IAE Academy

GATE EC · EE · IN

Probability and statistics

Probability and statistics is the mathematics of uncertainty: counting outcomes, assigning and updating probabilities, describing random quantities by their distributions, and summarising data by its centre, spread and correlation. The computations are mostly short and exact (a conditional probability, the mean or variance of a standard distribution, a normal-table look-up, a regression coefficient), so each formula has to be known together with the conditions under which it applies.

33 previous-year questions · 33 solved · 5 practice questions

Counting and the axioms of probability

A random experiment has a set of possible outcomes called the sample space ; an event is a subset of . Probability is a function on events that obeys three axioms, and every other rule is derived from them. When all outcomes are equally likely, probability reduces to counting, so permutations and combinations are the first tool.

AXIOMS OF PROBABILITY

The third axiom extends to any countable collection of pairwise mutually exclusive events. Consequences: and .

COMPLEMENT AND ADDITION RULE

Holds for any two events. Use the complement for every 'at least one' question: .

INCLUSION-EXCLUSION FOR THREE EVENTS

Add singles, subtract pairs, add the triple. The same pattern counts elements of a union: replace by .

CLASSICAL PROBABILITY

Only when the sample space has finitely many outcomes and all of them are equally likely.

PERMUTATIONS AND COMBINATIONS

Permutations count ordered arrangements of of distinct objects; combinations count unordered selections. and .

OTHER COUNTING RULES

In the second rule . The circular count treats rotations as the same arrangement; if reflections are also the same (a necklace), the count is for .

DRAWING WITHOUT REPLACEMENT (HYPERGEOMETRIC)

items are drawn without replacement from items, of which are of type 1. If the draws are made with replacement, the count is binomial with instead.

WORKED EXAMPLE

A box holds 5 red and 4 blue balls. Three balls are drawn at random without replacement. Find (a) the probability that exactly two are red, and (b) the probability that at least one is blue.

Solution
  1. All unordered selections of 3 balls are equally likely.

  2. (a) Choose 2 of the 5 red and 1 of the 4 blue: favourable selections, so .

  3. Check by the ordered view: the blue ball can be 1st, 2nd or 3rd, and each order has probability (the factors just rearrange), giving .

  4. (b) 'At least one blue' fails only when all three are red, which happens in ways. .

Answer: (a) ; (b)

EXAM TIP

Read every counting question for two things before you start: does order matter (permutation or combination), and are draws made with or without replacement? Changing either changes both the count and the distribution. For 'at least one', always go through the complement.

Conditional probability, independence and Bayes' theorem

is the probability of once we know that has occurred: the sample space shrinks to . Two events are independent when knowing one does not change the probability of the other. The theorem of total probability splits a hard probability into cases, and Bayes' theorem reverses the direction of conditioning, from 'evidence given cause' to 'cause given evidence'.

CONDITIONAL PROBABILITY

Undefined when . In general .

MULTIPLICATION RULE

The chain form is how sequential draws without replacement are multiplied along a tree.

INDEPENDENCE

Equivalently when . If are independent, so are and , and , and and . Three events are mutually independent only if all three pairwise products hold AND ; pairwise independence alone is not enough.

THEOREM OF TOTAL PROBABILITY

must partition : mutually exclusive, together exhaustive, each with .

BAYES' THEOREM

Same partition conditions, and . is the prior probability of cause ; is its posterior probability after observing .

Procedure for a Bayes question

  1. Name the possible causes (the partition) and write their prior probabilities; check that they add to 1.

  2. Write the likelihood for each cause.

  3. Multiply prior by likelihood for each cause (the branches of a tree diagram).

  4. Add these products: the sum is , by total probability.

  5. Divide the product for the cause asked about by that sum.

WORKED EXAMPLE

A binary source sends 0 with probability 0.6 and 1 with probability 0.4. The channel changes a transmitted 0 into 1 with probability 0.1, and a transmitted 1 into 0 with probability 0.2. A 1 is received. Find the probability that a 1 was sent, and the overall probability of a bit error.

Solution
  1. Partition by what was sent: , . Likelihoods of receiving 1: and .

  2. Total probability: .

  3. Bayes: .

  4. An error is '0 sent and 1 received' or '1 sent and 0 received': .

Answer: ;

EXAM TIP

Mutually exclusive and independent are different ideas. If and , mutually exclusive events are always dependent, because : knowing one occurred tells you the other did not.

Random variables: PMF, PDF, CDF, expectation and variance

A random variable assigns a real number to each outcome. A discrete random variable takes countably many values and is described by its probability mass function (PMF) . A continuous random variable is described by a probability density function (PDF) : probability is the area under , and itself is a density, not a probability, so it can exceed 1. Both kinds have a cumulative distribution function (CDF) . Throughout these notes, PMF means a discrete probability and PDF a continuous density.

PMF (DISCRETE)

To find an unknown constant in a PMF, set the total equal to 1.

PDF (CONTINUOUS)

For a continuous variable , so and give the same probability.

CDF

Every CDF is non-decreasing and right-continuous, with as and as . The relation holds for a continuous variable at every where is differentiable. For a discrete variable is a staircase that jumps by at each value , so and strict and non-strict inequalities give different answers.

EXPECTATION

The mean exists only when the sum or integral converges absolutely. does not need the distribution of itself.

VARIANCE AND STANDARD DEVIATION

Here . Variance is never negative, and is zero only when is a constant with probability 1. The second form is the one to compute with.

LINEAR TRANSFORMATION

For any constants . Adding moves the mean but not the spread; the sign of does not affect the variance.

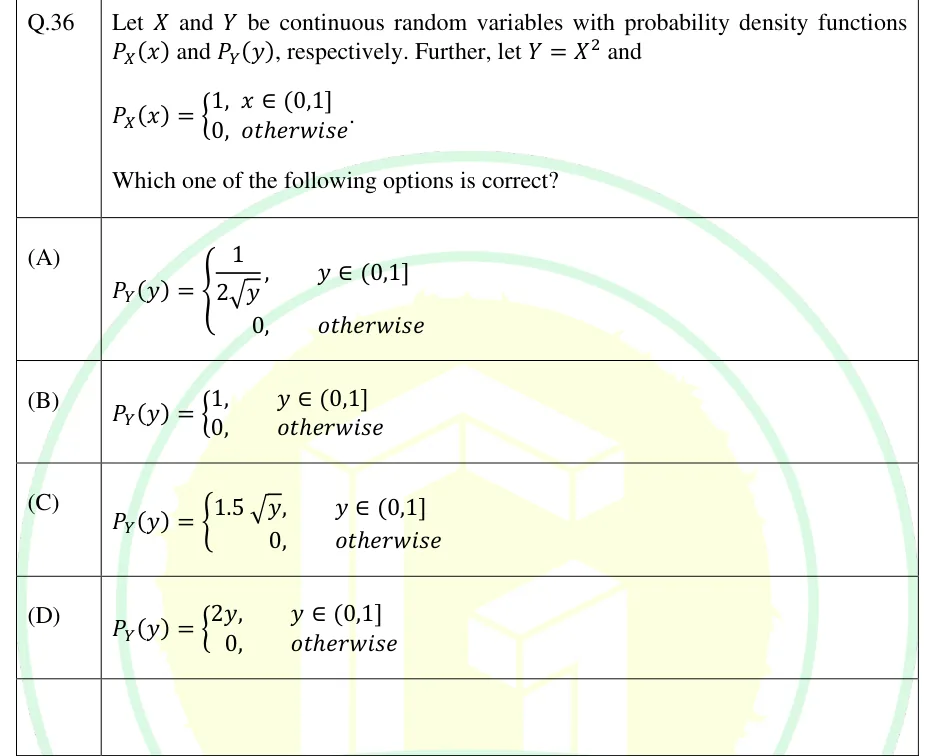
DENSITY OF A FUNCTION OF A RANDOM VARIABLE

For a that is not monotonic, work through the CDF: find , then differentiate. For example gives and for , with continuous.

MOMENTS

The first raw moment is the mean and the second central moment is the variance.

MOMENT GENERATING FUNCTION

Where exists on an open interval containing . For independent and , .

MEDIAN AND MODE OF A DISTRIBUTION

For a discrete variable, a median is any with and . A mode can sit at an end-point of the range.

WORKED EXAMPLE

A continuous random variable has PDF for and elsewhere. Find , the mean, variance, median and mode, and .

Solution
  1. Normalise: , so , and on .

  2. .

  3. , so .

  4. Median: gives . Mode: increases over , so the mode is .

  5. ; the plays no part.

Answer: , mean , variance , median , mode , . Mean < median < mode here because the density is skewed to the left.

EXAM TIP

A PDF value can exceed 1 (uniform on has ); only its integral is a probability. If is continuous, for every . When a CDF is given, differentiate it to get the PDF and read probabilities as differences ; do not integrate the CDF.

Standard distributions

Many problems reduce to recognising which standard model fits, then using its probability formula, mean or variance. The discrete models count successes or events; the continuous ones model measurements and waiting times. Two parameter conventions must be read off each question. For the exponential, these notes use the rate (mean ) and write ; some questions give the mean instead. For the normal, has the variance as its second parameter; some texts put the standard deviation there.

Distribution

PMF or PDF

Values

Mean

Variance

Bernoulli

Binomial

Poisson

Geometric, trial of first success

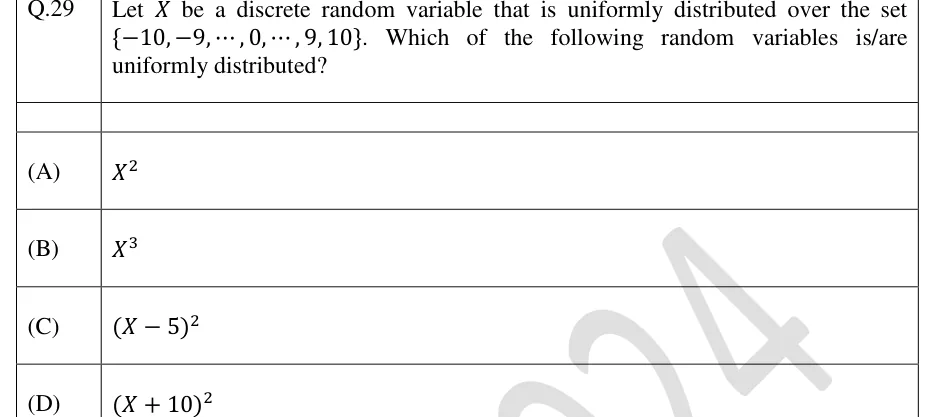
Discrete uniform on

Uniform

Exponential, rate

Normal

all real

BINOMIAL DISTRIBUTION

Number of successes in independent trials, each with the same success probability . Mean , variance , which is less than the mean whenever .

POISSON DISTRIBUTION

Count of events that occur independently at a constant average rate. Mean = variance = . If events occur as a Poisson process at rate per unit time, the count in a time is Poisson with .

POISSON AS A LIMIT OF THE BINOMIAL

Used as an approximation when is large and is small (rare events): put .

GEOMETRIC DISTRIBUTION

Convention here: is the number of the trial on which the first success occurs, and . If instead counts the failures before the first success, for , the mean becomes and the variance is unchanged. Among distributions on the positive integers, the geometric is the only memoryless one.

UNIFORM DISTRIBUTION

for and for . The probability of a sub-interval of is its length divided by .

EXPONENTIAL DISTRIBUTION

Rate ; and are zero for . Mean and variance , so the standard deviation equals the mean; the median is . It is the waiting time to the first event, and between successive events, of a Poisson process of rate .

MEMORYLESS PROPERTY

Holds for the exponential, the only continuous distribution with this property: a component that has survived to time has the same remaining-life distribution as a new one.

MINIMUM OF INDEPENDENT EXPONENTIALS

Proof: . Rates add, not means. The maximum is not exponential: .

NORMAL DISTRIBUTION

Symmetric about ; mean = median = mode = ; points of inflection at ; peak height .

STANDARDISATION AND THE TABLE CONVENTION

Convention in these notes: , the area to the LEFT of , with . Some tables list the area from 0 to , which equals ; check which one you are given.

THE 68-95-99.7 RULE (APPROXIMATE)

For a normal variable only. The rounded figures 68%, 95% and 99.7% are approximations; use the table value whenever a question supplies one. Standard quantiles: , , .

WORKED EXAMPLE

Packets arrive at a router as a Poisson process at an average rate of 3 per millisecond. Find (a) the probability of at most one arrival in a 0.5 ms window, and (b) the probability that the wait for the next arrival exceeds 0.5 ms. Take .

Solution
  1. The count in 0.5 ms is Poisson with .

  2. (a) .

  3. (b) The waiting time is exponential with rate 3 per ms: .

  4. Check: means no arrival in the window, and , the same number.

Answer: (a) ; (b)

WORKED EXAMPLE

Resistances from a production line are normal with mean and variance . What fraction lies between and ? Use and .

Solution
  1. The second parameter is the variance, so .

  2. and .

  3. .

Answer: , about 91%

EXAM TIP

Equal mean and variance is a property of the Poisson distribution, so it is a hint to try a Poisson model, though it does not by itself prove that a count is Poisson. A binomial has variance whenever . For Poisson probabilities, the recurrence saves recomputing factorials.

EXAM TIP

When a lifetime is exponential, a condition such as 'given that the device has already worked for 200 hours' does not change the probability that it lasts a further hours; this is the memoryless property at work. The same statement is false for the uniform and normal distributions.

Joint distributions, covariance and correlation

Two random variables observed together have a joint distribution: a joint PMF , or a joint PDF whose double integral over a region is the probability of that region. Summing or integrating out one variable gives the marginal distribution of the other. Covariance measures how the two vary together; the correlation coefficient is covariance rescaled to lie between and , and it measures linear association only.

JOINT PDF

Discrete case: replace the integrals by sums over the joint PMF table.

MARGINAL AND CONDITIONAL DISTRIBUTIONS

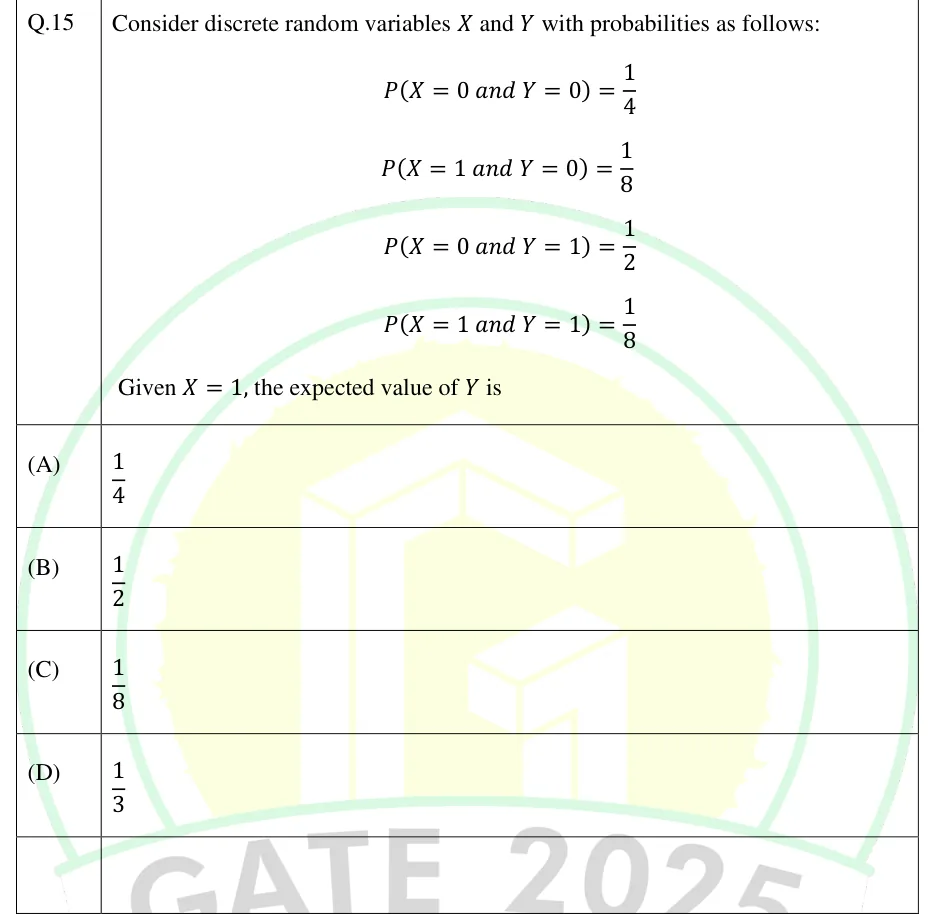
Discrete: (the totals along one direction of the table) and .

INDEPENDENCE OF RANDOM VARIABLES

Discrete case: one pair of values where the equality fails proves dependence. Continuous case: the equality must fail on a region of positive area (a single point proves nothing, since a density can be changed at a point); if both sides are continuous, one point of failure is enough. If the set where is not of the product form (for example the triangle ), and cannot be independent.

LAW OF TOTAL EXPECTATION

partition with each . is the mean of the conditional distribution: or . This is total probability applied to means.

COVARIANCE

and .

CORRELATION COEFFICIENT

Defined only when and . exactly when with probability 1 for some ( then has the sign of ). is unchanged by shifting either variable or rescaling it by a positive factor; rescaling one variable by a negative factor reverses its sign.

VARIANCE OF A LINEAR COMBINATION

Always true. When are uncorrelated (in particular, independent) the covariance term drops, so : variances add even for a difference.

SUMS OF RANDOM VARIABLES

Means always add; variances add when the variables are independent (pairwise uncorrelated is enough). Also, for independent : .

SUMS OF INDEPENDENT STANDARD VARIABLES

Each line requires the variables to be independent. A linear combination of independent normals is normal with mean and variance .

WORKED EXAMPLE

The joint PMF of and is , , , . Find , , and . Are and independent?

Solution
  1. Marginals: and , so and .

  2. , so .

  3. Both are Bernoulli: and . Then .

  4. .

  5. .

  6. Not independent: (equivalently, the covariance is non-zero).

Answer: , , , ; and are dependent.

EXAM TIP

Independent implies uncorrelated, but not the other way round. If is uniform on and , then , yet is completely determined by . (For jointly normal variables, zero correlation does imply independence; two variables that are each normal but not jointly normal need not have this property.)

Descriptive statistics, correlation and regression

For a data set the mean is the arithmetic average, the median is the middle value after sorting (the average of the two middle values when is even), and the mode is the most frequent value (there may be more than one). Spread is measured by the variance and its square root, the standard deviation.

Convention: sample vs population. The population variance divides the sum of squared deviations by . The sample variance divides by , which, for independent observations, makes it an unbiased estimate of the variance of the population the sample came from. In these notes uses and uses . Read the question for the words 'sample' or 'population': the two answers differ, and a multiple-choice question may offer both.

MEAN OF DATA

For grouped (class-interval) data, is the class mid-point and the result is an approximation. Deviations from the mean always sum to zero (weighted by frequency for frequency data).

VARIANCE AND STANDARD DEVIATION OF DATA

: population (divisor ); : sample (divisor ). The standard deviation is the positive square root. Adding a constant to every value changes neither; multiplying every value by multiplies the standard deviation by .

MEDIAN AND MODE OF GROUPED DATA

= lower boundary of the median (or modal) class, = class width, = total frequency, = cumulative frequency of the classes before the median class, = frequency of the median class; = frequency of the modal class, and those of the classes just before and after it. The mode formula assumes the modal class and its two neighbours have the same width .

EMPIRICAL MEAN-MEDIAN-MODE RELATION

An approximate rule for moderately skewed, single-peaked data only; it is not an identity.

CORRELATION COEFFICIENT OF DATA

Defined when neither variable is constant (); then . The divisors cancel, so is the same whether or is used, provided the same one is used throughout. Computational form: .

RANK CORRELATION (SPEARMAN)

is the difference between the two ranks of item . Valid when there are no tied ranks; with ties, give tied items the average of their ranks and compute from the ranks directly. Like , it lies between and .

THE TWO REGRESSION LINES

The line of on minimises the sum of squared vertical deviations and is used to predict from ; the line of on minimises squared horizontal deviations and predicts from . Both lines pass through .

PRODUCT OF THE REGRESSION COEFFICIENTS

, and all have the same sign, and that common sign is taken for . Since , the two coefficients cannot both exceed 1 in magnitude.

LEAST-SQUARES NORMAL EQUATIONS FOR Y = A + BX

Solving them gives and , which is the regression line of on .

Given two regression lines, deciding which is which

  1. Their intersection is : solve the two equations simultaneously.

  2. Assume the first is the line of on : rewrite it as and read as the coefficient of . Rewrite the second as and read as the coefficient of .

  3. The two coefficients must have the same sign. The products given by the two possible assignments are reciprocals of each other, so exactly one of them is less than 1 (for two distinct lines): if the assumption is right; if the product exceeds 1, swap the roles.

  4. Then , with the common sign of the two coefficients.

  5. If the two lines coincide; if they are and , at right angles.

WORKED EXAMPLE

For the five pairs : , find , the regression line of on and the predicted at , and verify that .

Solution
  1. and . Deviations: and .

  2. , , .

  3. .

  4. , so , i.e. . At (just outside the data, so an extrapolation): .

  5. , so . The two coefficients happen to be equal here because .

Answer: ; ; predicted at .

EXAM TIP

A change of origin does not affect or either regression coefficient. A change of scale , with leaves unchanged but gives . Correlation measures linear association only: does not mean the variables are unrelated, and a large does not show that one causes the other.

Sampling distributions and the central limit theorem

A random sample is a set of independent observations from the same distribution, with mean and variance . A statistic computed from it, such as the sample mean , is itself a random variable, and its distribution is called a sampling distribution.

The syllabus phrase 'sampling theorems' (EE) is not defined further. These notes read it as the results below on the sampling distribution of and , together with the central limit theorem; it is distinct from the sampling theorem for signals (reconstruction from samples taken faster than the Nyquist rate), which belongs to Signals and Systems. 'Sampling from distributions' (IN) is read as covering the same results and, in the simulation sense, generating values that follow a given distribution (the last formula below).

SAMPLING DISTRIBUTION OF THE MEAN

Needs only independence (uncorrelated is enough) and a common mean and variance, not normality. Quadrupling halves the standard error.

UNBIASED SAMPLE VARIANCE

Dividing by instead gives an estimate whose expected value is , slightly too small; this is why the sample variance uses .

CENTRAL LIMIT THEOREM

For independent, identically distributed with finite, non-zero variance, whatever their distribution. If the are themselves normal, the result is exact for every .

NORMAL APPROXIMATION TO THE BINOMIAL

A consequence of the CLT. The is the continuity correction for a discrete variable; in the same way . A common rule of thumb asks for and both at least about 5 (some texts ask for 10).

CHEBYSHEV'S INEQUALITY

Holds for ANY distribution with finite variance, so it is a loose bound (and says nothing for ): for a normal variable the true probability at is about , against the bound . Applied to , whose variance is , it gives for every : the weak law of large numbers.

INVERSE-TRANSFORM SAMPLING

If is a continuous, strictly increasing CDF, then has CDF . Example: is exponential with rate .

WORKED EXAMPLE

A population has mean 50 and standard deviation 12; its distribution is not known. A random sample of 36 is taken. Using , find the approximate probability that the sample mean exceeds 53.

Solution
  1. By the CLT, is approximately normal with mean 50 and standard error .

  2. .

  3. .

Answer: About .

EXAM TIP

Keep (the spread of one observation) apart from (the spread of the mean of independent observations). A question about one item uses ; a question about the average of items uses , and one about their total uses .

PREVIOUS-YEAR QUESTIONS

33 questions from the EC, EE and IN papers

Try each question first, then open the answer. We placed each question under a topic ourselves; the exam paper does not label topics.

See these papers in full: GATE ECE 2026 · GATE ECE 2025 · GATE ECE 2024 · GATE ECE 2023 · GATE ECE 2022 · GATE ECE 2020 · GATE ECE 2018 · GATE EE 2026 · GATE EE 2025 · GATE EE 2024 · GATE EE 2023 · GATE EE 2022 · GATE IN 2026 · GATE IN 2025 · GATE IN 2024 · GATE IN 2023 · GATE IN 2022 · GATE IN 2020 · GATE IN 2018

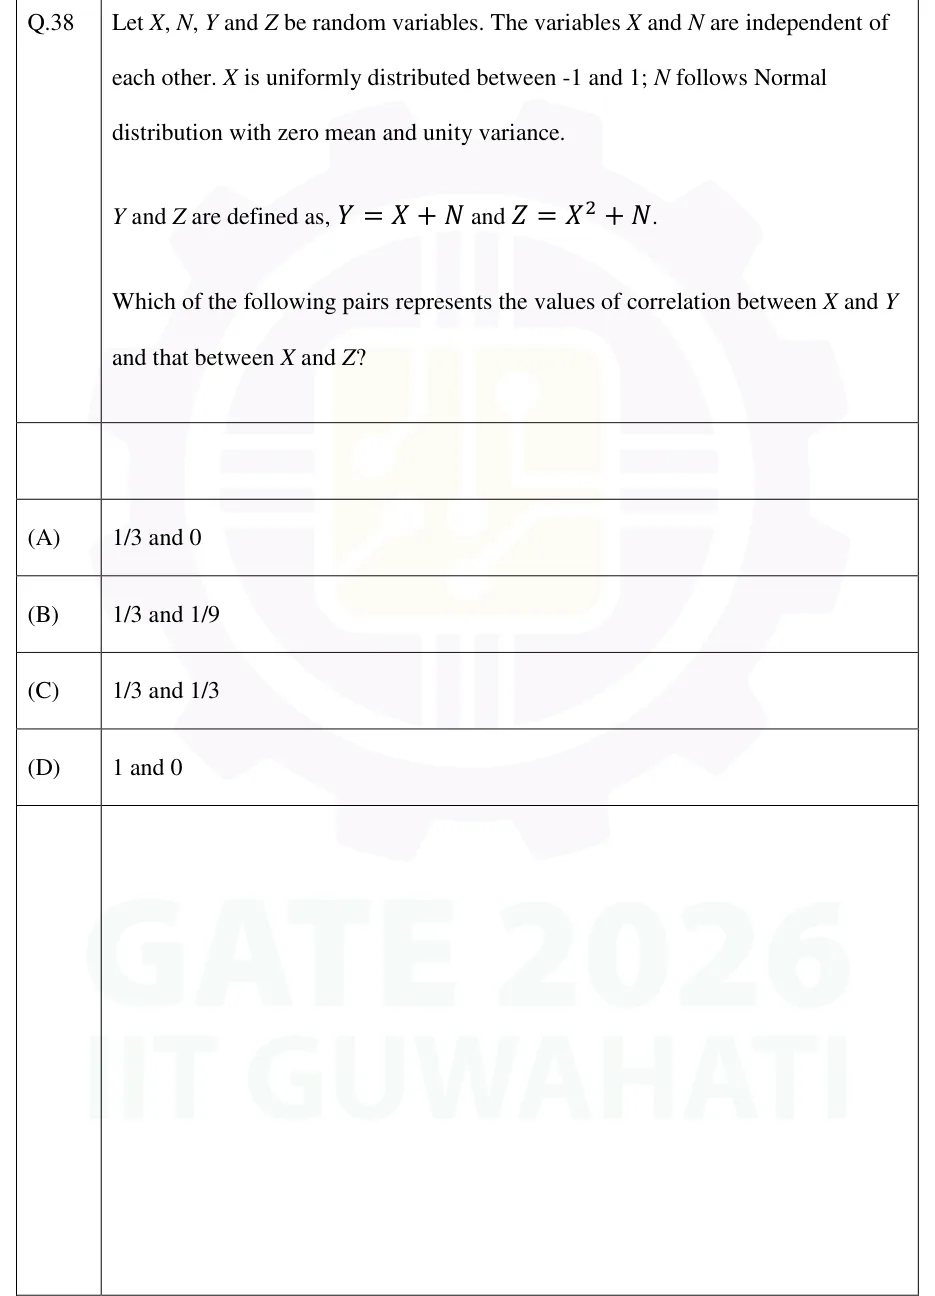
GATE 2026 EC Q.38

GATE 2026 · ECQ.38 · 2 marks · MCQ

Let , , and be random variables. The variables and are independent of each other. is uniformly distributed between -1 and 1; follows Normal distribution with zero mean and unity variance.

and are defined as, and .

Which of the following pairs represents the values of correlation between and and that between and ?

  1. (A)

    1/3 and 0

  2. (B)

    1/3 and 1/9

  3. (C)

    1/3 and 1/3

  4. (D)

    1 and 0
Answer and solution
See the question in the paper
GATE 2026 EC Q.38: answer and solution

GATE 2025 EE Q.36

GATE 2025 · EEQ.36 · 2 marks · MCQ

Let and be continuous random variables with probability density functions and , respectively. Further, let and

Which one of the following options is correct?

  1. (A)

  2. (B)

  3. (C)

  4. (D)

Answer and solution
See the question in the paper
GATE 2025 EE Q.36: answer and solution

GATE 2024 IN Q.35

GATE 2024 · INQ.35 · 1 mark · NAT

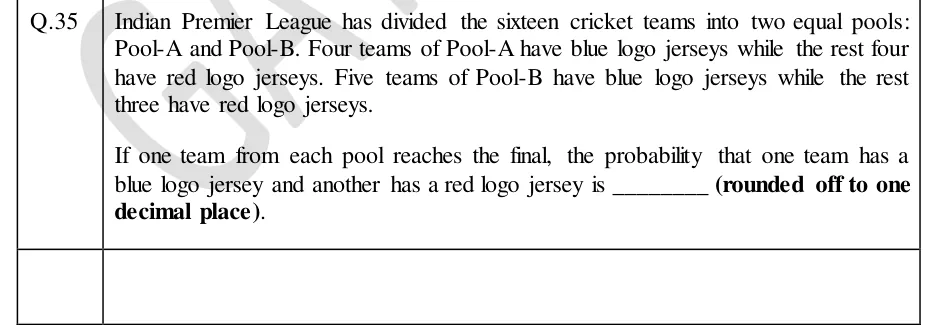
Indian Premier League has divided the sixteen cricket teams into two equal pools: Pool-A and Pool-B. Four teams of Pool-A have blue logo jerseys while the rest four have red logo jerseys. Five teams of Pool-B have blue logo jerseys while the rest three have red logo jerseys.

If one team from each pool reaches the final, the probability that one team has a blue logo jersey and another has a red logo jersey is ________ (rounded off to one decimal place).

Answer and solution
See the question in the paper
GATE 2024 IN Q.35: answer and solution

GATE 2024 IN Q.50

GATE 2024 · INQ.50 · 2 marks · NAT

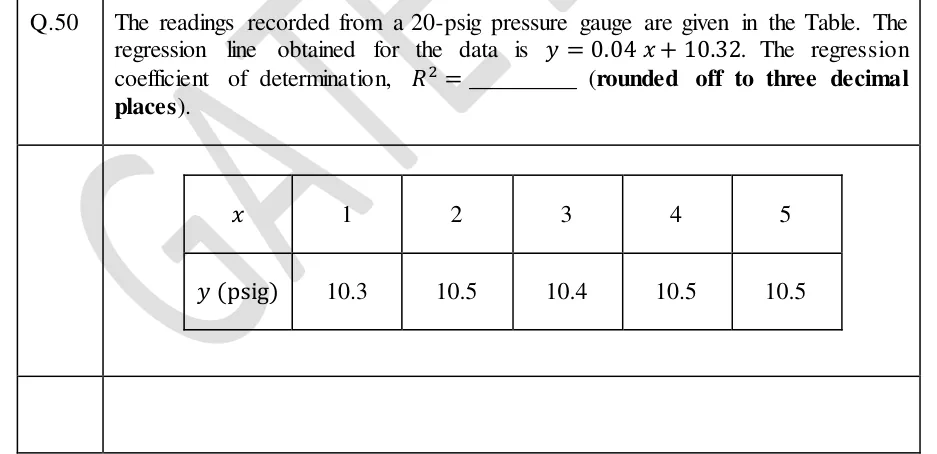
The readings recorded from a 20-psig pressure gauge are given in the Table. The regression line obtained for the data is . The regression coefficient of determination, ________ (rounded off to three decimal places).

| | 1 | 2 | 3 | 4 | 5 |
|---|---|---|---|---|---|
| (psig) | 10.3 | 10.5 | 10.4 | 10.5 | 10.5 |

GATE 2024 IN question 50: A two-row data table.Tap to open full size
Figure from the GATE 2024 IN paper. It is part of the question.
Figure description

A two-row data table. Row 1, header x: 1, 2, 3, 4, 5. Row 2, header y (psig): 10.3, 10.5, 10.4, 10.5, 10.5.

Answer and solution
GATE 2024 IN Q.50: answer and solution

GATE 2023 EC Q.36

GATE 2023 · ECQ.36 · 2 marks · MCQ

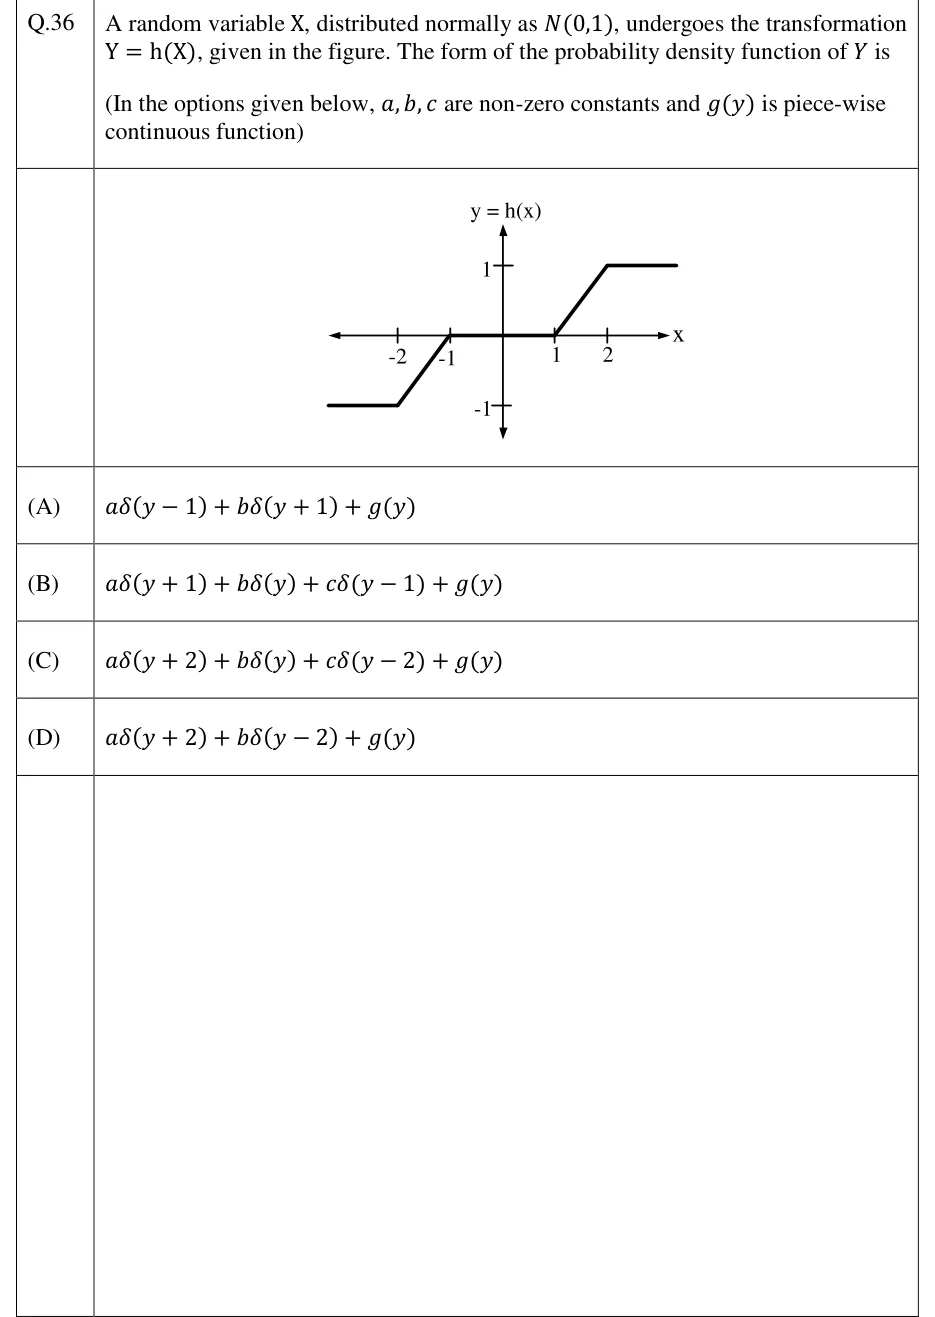
A random variable X, distributed normally as , undergoes the transformation , given in the figure. The form of the probability density function of is

(In the options given below, are non-zero constants and is piece-wise continuous function)

GATE 2023 EC question 36: Graph of y = h(x), horizontal axis X with ticks at -2, -1, 1, 2 and vertical axis y = h(x) with ticks at 1 and -1.Tap to open full size
Figure from the GATE 2023 EC paper. It is part of the question.
Figure description

Graph of y = h(x), horizontal axis X with ticks at -2, -1, 1, 2 and vertical axis y = h(x) with ticks at 1 and -1. The curve is piecewise linear: a horizontal segment at y = -1 for x <= -2 (drawn from about x = -3 to x = -2); a straight line rising from (-2, -1) to (-1, 0); a horizontal segment on the x-axis at y = 0 from x = -1 to x = 1; a straight line rising from (1, 0) to (2, 1); a horizontal segment at y = 1 for x >= 2 (drawn from x = 2 to about x = 3). So h(x) = -1 for x <= -2, h(x) = x + 1 for -2 <= x <= -1, h(x) = 0 for -1 <= x <= 1, h(x) = x - 1 for 1 <= x <= 2, h(x) = 1 for x >= 2.

  1. (A)

  2. (B)

  3. (C)

  4. (D)

Answer and solution
GATE 2023 EC Q.36: answer and solution

GATE 2023 EE Q.25

GATE 2023 · EEQ.25 · 1 mark · MCQ

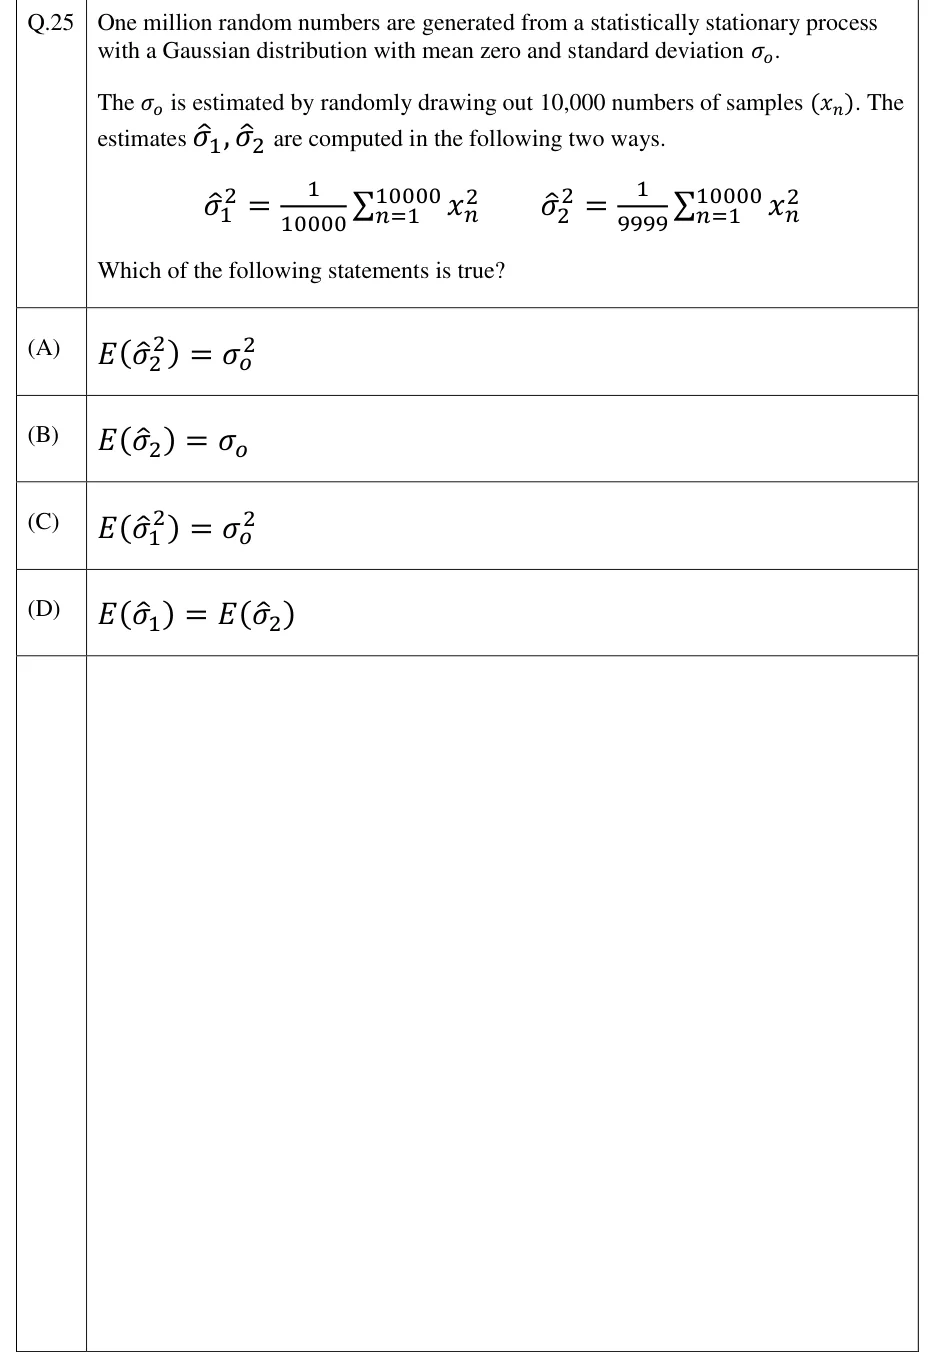
One million random numbers are generated from a statistically stationary process with a Gaussian distribution with mean zero and standard deviation .

The is estimated by randomly drawing out 10,000 numbers of samples . The estimates are computed in the following two ways.

Which of the following statements is true?

  1. (A)

  2. (B)

  3. (C)

  4. (D)

Answer and solution
See the question in the paper
GATE 2023 EE Q.25: answer and solution

GATE 2022 EC Q.31

GATE 2022 · ECQ.31 · 1 mark · NAT

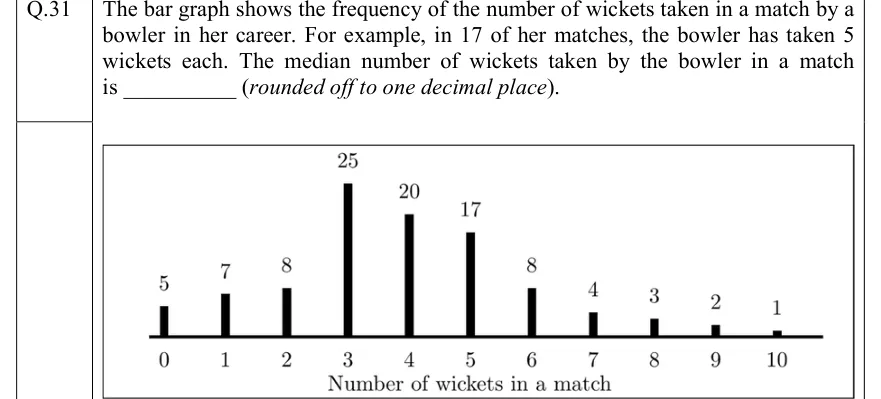
The bar graph shows the frequency of the number of wickets taken in a match by a bowler in her career. For example, in 17 of her matches, the bowler has taken 5 wickets each. The median number of wickets taken by the bowler in a match is ________ (rounded off to one decimal place).

GATE 2022 EC question 31: Vertical bar graph.Tap to open full size
Figure from the GATE 2022 EC paper. It is part of the question.
Figure description

Vertical bar graph. Horizontal axis labelled 'Number of wickets in a match', with ticks 0, 1, 2, 3, 4, 5, 6, 7, 8, 9, 10. A bar stands above each tick with its frequency printed on top: 0 wickets: 5; 1 wicket: 7; 2 wickets: 8; 3 wickets: 25; 4 wickets: 20; 5 wickets: 17; 6 wickets: 8; 7 wickets: 4; 8 wickets: 3; 9 wickets: 2; 10 wickets: 1. There is no vertical axis scale; bar heights are proportional to the printed frequencies.

Answer and solution
GATE 2022 EC Q.31: answer and solution

GATE 2022 EC Q.48

GATE 2022 · ECQ.48 · 2 marks · MSQ

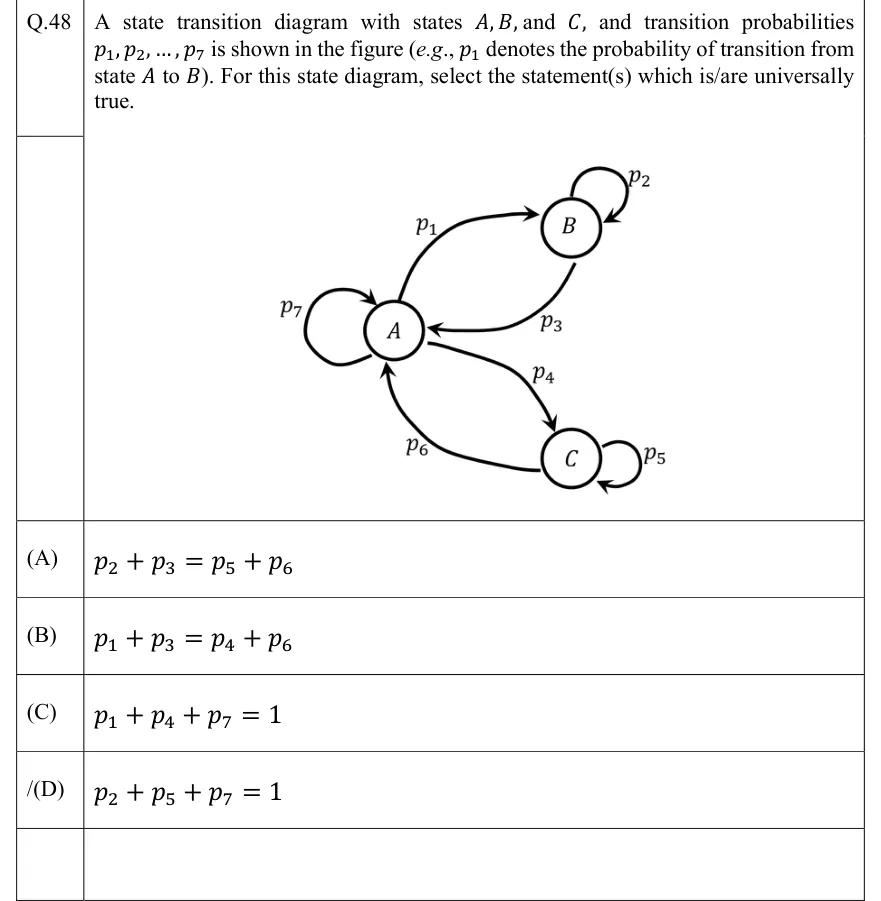
A state transition diagram with states , , and , and transition probabilities is shown in the figure (e.g., denotes the probability of transition from state to ). For this state diagram, select the statement(s) which is/are universally true.

GATE 2022 EC question 48: Three circular states A, B, C.Tap to open full size
Figure from the GATE 2022 EC paper. It is part of the question.
Figure description

Three circular states A, B, C. Arrows: from A to B labelled p_1; self-loop on B labelled p_2; from B to A labelled p_3; from A to C labelled p_4; self-loop on C labelled p_5; from C to A labelled p_6; self-loop on A labelled p_7. So A has outgoing edges p_1 (to B), p_4 (to C), p_7 (to itself); B has outgoing edges p_2 (to itself), p_3 (to A); C has outgoing edges p_5 (to itself), p_6 (to A). The printed label of option D carries a stray mark, reading '/(D)'.

  1. (A)

  2. (B)

  3. (C)

  4. (D)

Answer and solution
GATE 2022 EC Q.48: answer and solution

GATE 2020 EC Q.25

GATE 2020 · ECQ.25 · 1 mark · NAT

The two sides of a fair coin are labelled as 0 and 1. The coin is tossed two times independently. Let and denote the labels corresponding to the outcomes of those tosses. For a random variable , defined as , the expected value (rounded off to two decimal places) is ________.

Answer and solution
See the question in the paper
GATE 2020 EC Q.25: answer and solution

GATE 2020 IN Q.16

GATE 2020 · INQ.16 · 1 mark · NAT

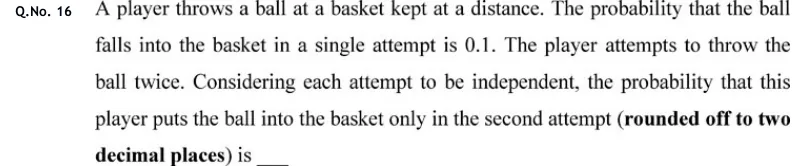
A player throws a ball at a basket kept at a distance. The probability that the ball falls into the basket in a single attempt is 0.1. The player attempts to throw the ball twice. Considering each attempt to be independent, the probability that this player puts the ball into the basket only in the second attempt (rounded off to two decimal places) is ____

Answer and solution
See the question in the paper
GATE 2020 IN Q.16: answer and solution

GATE 2020 IN Q.32

GATE 2020 · INQ.32 · 2 marks · NAT

Consider two identical bags B1 and B2 each containing 10 balls of identical shapes and sizes. Bag B1 contains 7 Red and 3 Green balls, while bag B2 contains 3 Red and 7 Green balls. A bag is picked at random and a ball is drawn from it, which was found to be Red. The probability that the Red ball came from bag B1 (rounded off to one decimal place) is ____

Answer and solution
See the question in the paper
GATE 2020 IN Q.32: answer and solution

GATE 2018 IN Q.27

GATE 2018 · INQ.27 · 2 marks · MCQ

Two bags and have equal number of balls. Bag has 20% red balls and 80% green balls. Bag has 30% red balls, 60% green balls and 10% yellow balls. Contents of Bags and are mixed thoroughly and a ball is randomly picked from the mixture. What is the chance that the ball picked is red?

  1. (A)

    20%

  2. (B)

    25%

  3. (C)

    30%

  4. (D)

    40%

Answer and solution
See the question in the paper
GATE 2018 IN Q.27: answer and solution

PRACTICE

5 questions to test yourself

PRACTICE 11 mark · MCQ

The five observations are a sample drawn from a larger population. Their sample standard deviation (divisor ) is

  1. (A)

  2. (B)

  3. (C)

  4. (D)

Answer and solution

Answer: (B)

  1. Mean .

  2. Squared deviations: ; their sum is .

  3. , so .

  4. Option A is the population standard deviation , C the population variance and D the sample variance.

PRACTICE 21 mark · NAT

A machine is faulty with probability 0.02. Its alarm sounds with probability 0.95 when the machine is faulty and with probability 0.03 when it is not. Given that the alarm has sounded, the probability that the machine is faulty is ______ (round off to three decimal places).

Answer and solution

Answer: (accepted range )

  1. Total probability: .

  2. Bayes: .

  3. Despite the 95% detection rate, most alarms are false, because faults are rare.

PRACTICE 32 marks · MSQ

The two regression lines of a bivariate data set are and . Which of the following statements is/are correct?

  1. (A)

    and

  2. (B)

    The regression coefficient of on is

  3. (C)

    The correlation coefficient is

  4. (D)

    The regression coefficient of on is

Answer and solution

Answer: (A), (B)

  1. The lines meet at the means: and . Tripling the first gives ; subtracting it from the second gives , so and then . A is correct.

  2. Take the first as on : , so . Take the second as on : , so . The product is , so this assignment is valid.

  3. The other assignment would give and , with product , which is impossible. So B is correct and D is not.

  4. (both coefficients are positive), so C is wrong.

PRACTICE 42 marks · NAT

and are independent normal random variables with and , where the second parameter is the variance. Using , where is the standard normal CDF, is ______ (round off to four decimal places).

Answer and solution

Answer: (accepted range )

  1. is normal, being a linear combination of independent normal variables.

  2. and (variances add for a difference), so .

  3. .

PRACTICE 52 marks · MSQ

The joint PDF of and is for , , and zero elsewhere. Which of the following is/are correct?

  1. (A)

  2. (B)

    and are independent

  3. (C)

  4. (D)

Answer and solution

Answer: (A), (C)

  1. , so . A is correct.

  2. Marginals: and . Their product is , which is not : at the joint PDF is but the product is . Both expressions are continuous on the square, so they differ on a whole neighbourhood of that corner, a region of positive area. and are dependent, and B is wrong.

  3. . C is correct.

  4. and .

  5. . D is wrong.

OFFICIAL GATE 2027 SYLLABUS WORDING

Copied from the GATE 2027 syllabus; see all 2027 syllabi.

GATE EC

Mean, median, mode, standard deviation, combinatorial probability, probability distributions, binomial distribution, Poisson distribution, exponential distribution, normal distribution, joint and conditional probability, correlation and regression analysis

GATE EE

Sampling theorems, Conditional probability, Mean, Median, Mode, Standard Deviation, Random variables, Discrete and Continuous distributions, Poisson distribution, Normal distribution, Binomial distribution, Correlation analysis, Regression analysis

GATE IN

Random variables, discrete and continuous distributions: normal, Poisson and Binomial distributions. Sampling from distributions, conditional probability and Bayes' theorem, mean, median, mode, standard deviation and variance

Preparing in Kolkata? IAE Academy's course for GATE ECE, GATE EE or GATE IN.