
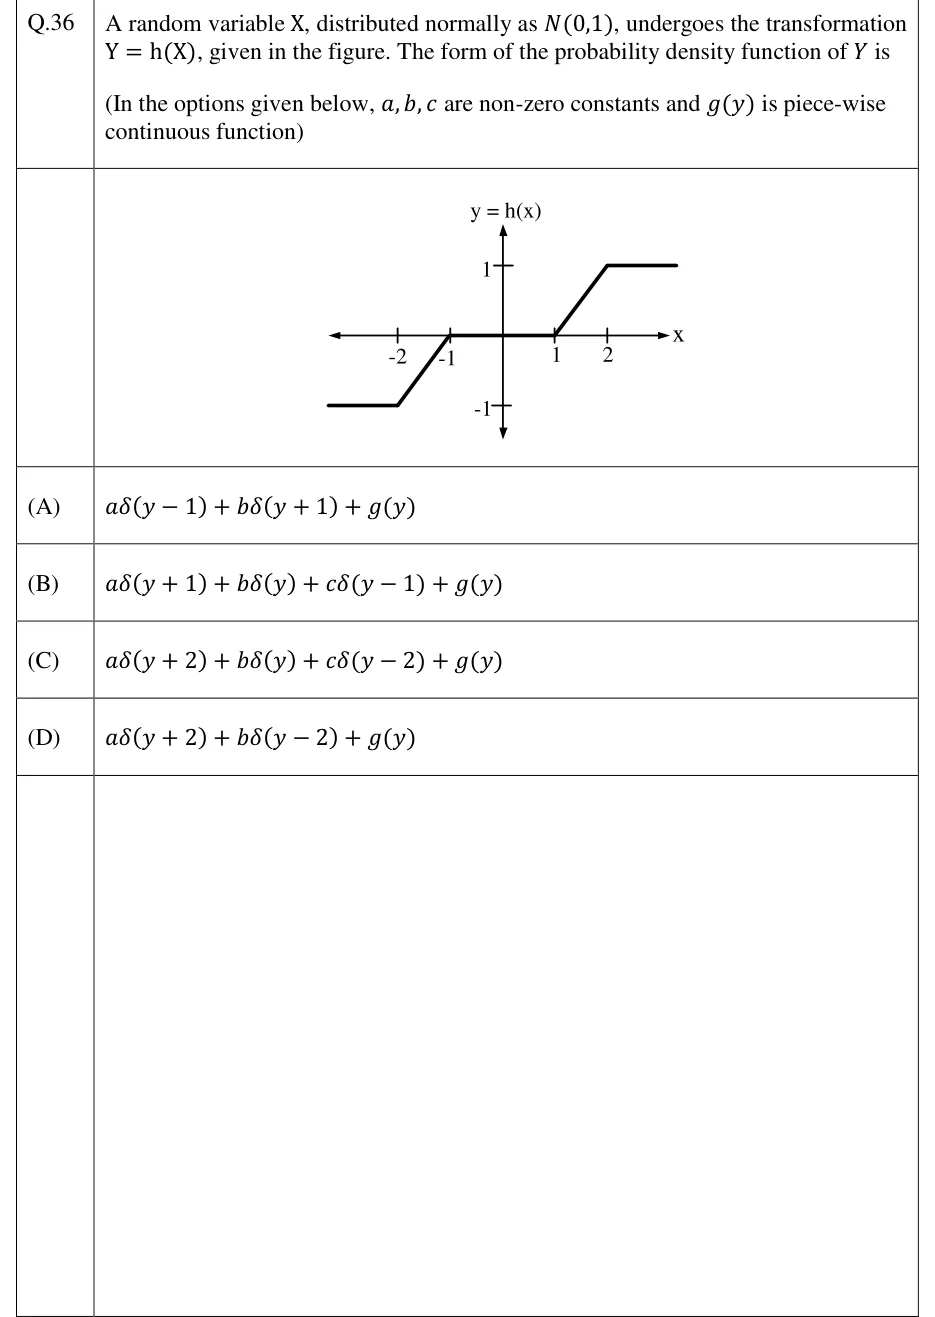
A random variable X, distributed normally as , undergoes the transformation , given in the figure. The form of the probability density function of is
(In the options given below, are non-zero constants and is piece-wise continuous function)
 Tap to open full size
Figure description
Graph of y = h(x), horizontal axis X with ticks at -2, -1, 1, 2 and vertical axis y = h(x) with ticks at 1 and -1. The curve is piecewise linear: a horizontal segment at y = -1 for x <= -2 (drawn from about x = -3 to x = -2); a straight line rising from (-2, -1) to (-1, 0); a horizontal segment on the x-axis at y = 0 from x = -1 to x = 1; a straight line rising from (1, 0) to (2, 1); a horizontal segment at y = 1 for x >= 2 (drawn from x = 2 to about x = 3). So h(x) = -1 for x <= -2, h(x) = x + 1 for -2 <= x <= -1, h(x) = 0 for -1 <= x <= 1, h(x) = x - 1 for 1 <= x <= 2, h(x) = 1 for x >= 2.
- (A)
- (B)
- (C)
- (D)