GATE 2025 EE Q.49
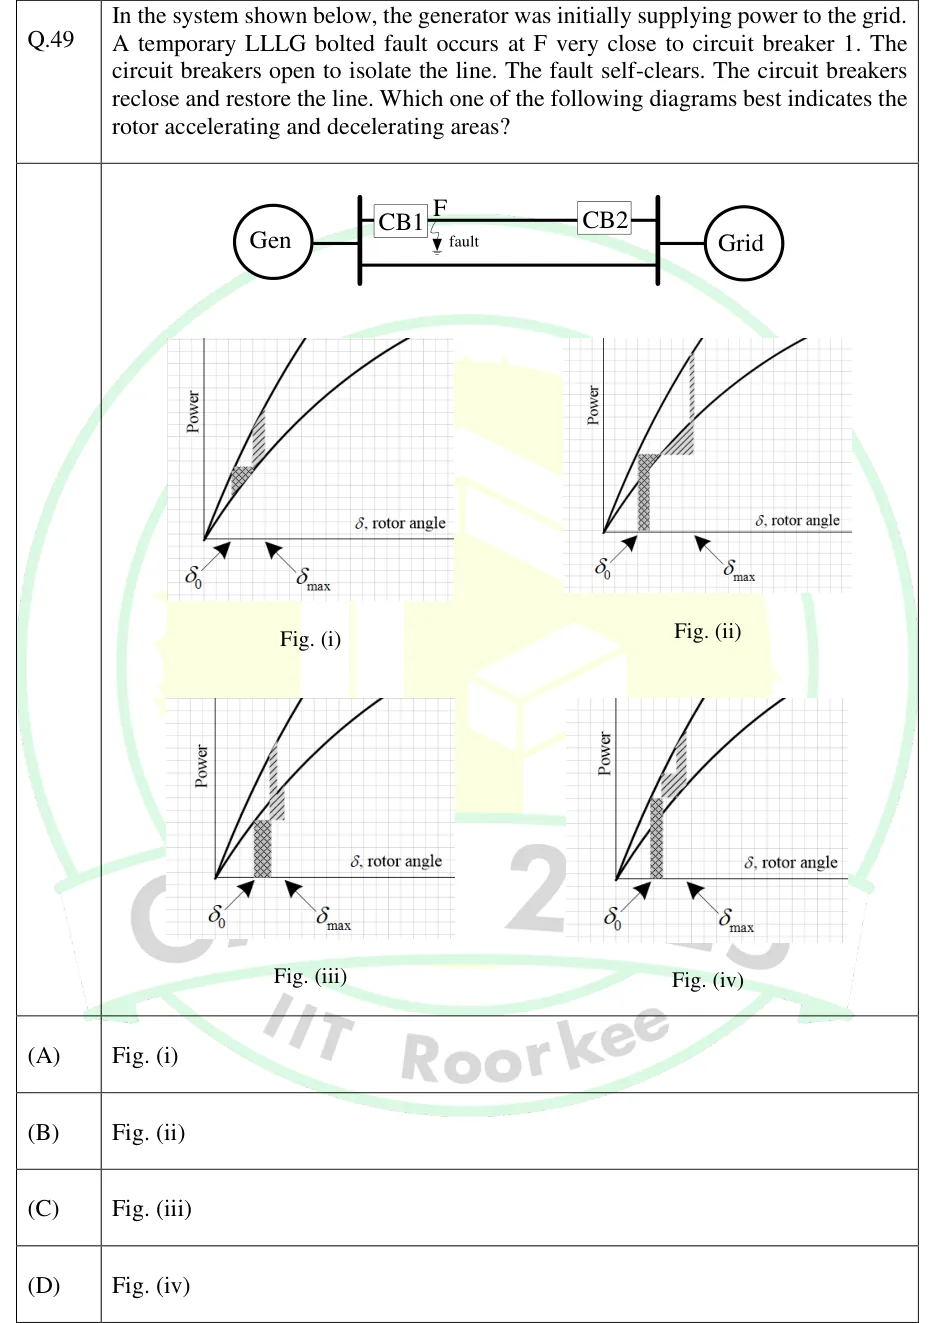
In the system shown below, the generator was initially supplying power to the grid. A temporary LLLG bolted fault occurs at F very close to circuit breaker 1. The circuit breakers open to isolate the line. The fault self-clears. The circuit breakers reclose and restore the line. Which one of the following diagrams best indicates the rotor accelerating and decelerating areas?
 Tap to open full size
Figure description
Single-line diagram: Gen connected to a bus, two parallel lines to the Grid bus; the upper line carries CB1 (near Gen end) and CB2 (near Grid end), with fault point F marked on the line just beside CB1. Four power-angle plots (Fig. i to iv), each with Power versus rotor angle, an upper steeper curve and a lower flatter curve from the origin, with delta_0 and delta_max marked on the axis. Fig (i): small hatched patches staying between the curves. Fig (ii): a tall cross-hatched rectangle from delta_0 with top at the upper curve, then a hatched wedge below the horizontal level, then a vertical-hatched area above that level up to the upper curve. Figs (iii) and (iv): similar patches with different shapes.
- (A)
Fig. (i)
- (B)
Fig. (ii)
- (C)
Fig. (iii)
- (D)
Fig. (iv)