
IAE Academy

GATE 2025 EE Q.49: solution and answer

GATE 2025 · EEQ.49 · 2 marks · MCQ

In the system shown below, the generator was initially supplying power to the grid. A temporary LLLG bolted fault occurs at F very close to circuit breaker 1. The circuit breakers open to isolate the line. The fault self-clears. The circuit breakers reclose and restore the line. Which one of the following diagrams best indicates the rotor accelerating and decelerating areas?
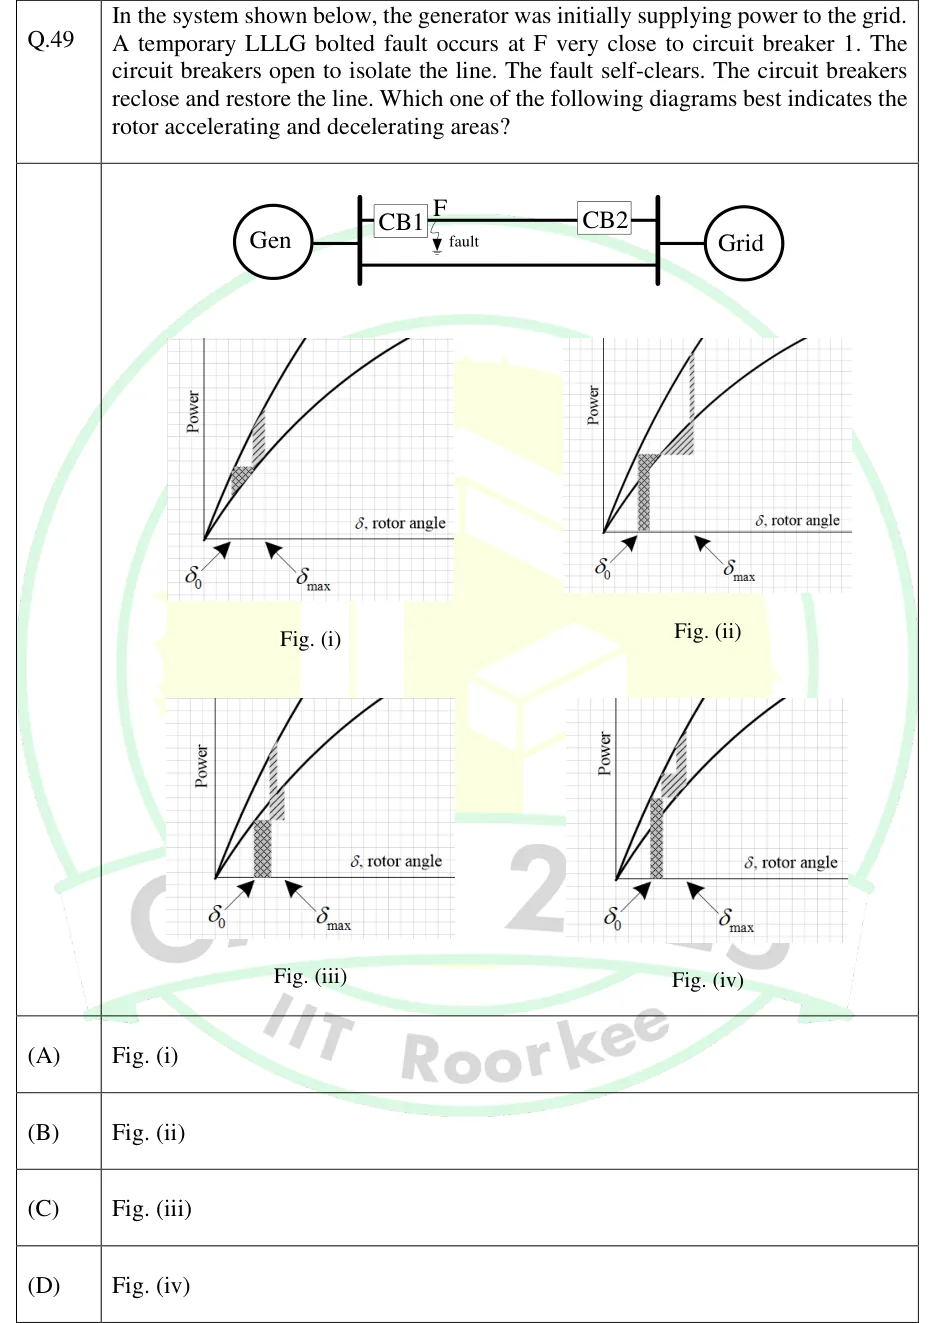
GATE 2025 EE question 49: Single-line diagram: Gen connected to a bus, two parallel lines to the Grid bus;Tap to open full size
Figure from the GATE 2025 EE paper. It is part of the question.
Figure description

Single-line diagram: Gen connected to a bus, two parallel lines to the Grid bus; the upper line carries CB1 (near Gen end) and CB2 (near Grid end), with fault point F marked on the line just beside CB1. Four power-angle plots (Fig. i to iv), each with Power versus rotor angle, an upper steeper curve and a lower flatter curve from the origin, with delta_0 and delta_max marked on the axis. Fig (i): small hatched patches staying between the curves. Fig (ii): a tall cross-hatched rectangle from delta_0 with top at the upper curve, then a hatched wedge below the horizontal level, then a vertical-hatched area above that level up to the upper curve. Figs (iii) and (iv): similar patches with different shapes.

  1. (A)

    Fig. (i)

  2. (B)

    Fig. (ii)

  3. (C)

    Fig. (iii)

  4. (D)

    Fig. (iv)

Answer and solution

ANSWER

Option (B), Fig. (ii).

Official answer: BSource: Official answer key, GATE 2025 EE (IIT Roorkee)

  1. Before the fault both lines are in service and the generator delivers . The operating point is on the upper (two-line) power-angle curve, so .

  2. The bolted LLLG fault is at F, very close to circuit breaker 1, which sits at the generator end. The voltage at the generator terminal collapses to almost zero, so the electrical power delivered is during the fault.

  3. With the accelerating power is the whole of . The accelerating area is a rectangle, , with its top at the horizontal level and its base on the axis starting at .

  4. The breakers open and isolate the faulted line. Only the other line remains, with higher reactance, so follows the lower (one-line) curve. At the clearing angle this curve is still below , so the net power is still accelerating. The rotor keeps speeding up and picks up a second accelerating area, a wedge between the level and the lower curve.

  5. The fault self-clears and the breakers reclose, restoring both lines. jumps back to the upper curve, which is above at that angle. The net power is now decelerating, and the decelerating area lies between the upper curve and the horizontal level.

  6. The required picture therefore shows, in order, a tall rectangle from with its top at the level, then a wedge between the level and the lower curve, then a vertical jump to the upper curve with the decelerating area above the level. This is Fig. (ii). Fig. (i) has only small patches and no full rectangle, so it does not show . Figs. (iii) and (iv) do not follow this sequence of areas. The answer is option B.

KEY IDEA

A bolted three-phase fault at the generator terminal makes , so the accelerating area is a full rectangle at the level. With the faulted line out, is on the lower curve, below , which adds an accelerating wedge. Reclosing returns to the upper curve, above , which gives the decelerating area.

WATCH OUT FOR

Drawing the accelerating area between the pre-fault and during-fault curves as if the fault only reduced power partly. A bolted fault right at the generator end drops to nearly zero. Another slip is forgetting the extra accelerating wedge while the single line is in service, or shading decelerating area before the line is restored.

From the GATE 2025 EE paper. Every question of this paper · Download the full paper · All 4 Stability questions, with notes

More Stability questions