IAE Academy

EVERY GATE PAPER

Elementary statistics and probability

Elementary statistics describes a set of numbers by its averages (mean, median, mode) and its spread (range, variance, standard deviation). Elementary probability measures the chance of an event by counting equally likely outcomes and applying a few rules: complement, addition, conditional probability, independence and expected value. Most of the work on this topic lies in choosing the right formula, the right sample space and the right convention (ordered outcomes, with or without replacement, population variance), not in long arithmetic.

7 previous-year questions · 6 solved · 5 practice questions

Averages: mean, median and mode

An average is one number that stands for a whole data set. The mean uses every value. The median is the middle value once the data are sorted. The mode is the value that occurs most often. Throughout these notes is the number of observations and is their mean.

ARITHMETIC MEAN

Uses every observation, so one extreme value can move it a lot. Total of all values , and many mean questions become simple once they are worked through totals.

WEIGHTED MEAN (ALSO THE MEAN OF A FREQUENCY TABLE)

Weights , not all zero. For a frequency table put , the frequency of the value . For grouped data (class intervals), take as the mid-point of each class.

COMBINED MEAN OF TWO GROUPS

The group sizes act as weights. The combined mean always lies between the two group means (it equals both when they are equal). When the group sizes differ, it lies nearer the mean of the larger group; when the sizes are equal, it is exactly midway.

Finding the median

  1. Arrange the observations in ascending (or descending) order.

  2. If is odd, the median is the th observation.

  3. If is even, the median is the mean of the th and th observations. The result need not be one of the data values.

  4. For a frequency table, write the cumulative frequencies and read off the value(s) at the position(s) found above.

The mode is the most frequent value. A data set can have one mode or several (bimodal, multimodal). When every value occurs the same number of times it has none, by the usual convention. The mode is the only one of the three averages that makes sense for categories with no natural order, such as favourite colours. (Ordered categories, such as shirt sizes S, M, L, also have a median.)

MEDIAN AND MODE OF GROUPED DATA (CLASSES OF EQUAL WIDTH)

is the total frequency and the common class width. Median: the median class is the first class whose cumulative frequency reaches ; is its lower boundary, its frequency and the cumulative frequency of all the classes before it. Mode: the modal class is the class with the highest frequency; is its lower boundary, its frequency, and , are the frequencies of the classes just before and just after it (take 0 if there is no such class). Both formulas are estimates that assume the values are spread evenly within each class.

EMPIRICAL RELATION BETWEEN THE THREE AVERAGES

Approximate, and only for moderately skewed data with a single peak. Use it when a question asks for it, or gives two of the three averages and asks for the third. Equivalent form: .

Shape of the distribution

Order of the averages

Symmetric, single peak

Mean = Median = Mode

Positively skewed (long tail to the right)

Usually Mode < Median < Mean

Negatively skewed (long tail to the left)

Usually Mean < Median < Mode

EXAM TIP

Two properties of the mean are often useful. The deviations from the mean always add to zero: . And is smallest when , while is smallest when is the median (for even , any value from the lower middle value to the upper middle value does equally well). With three or more observations, increasing the largest value changes the mean but not the median.

GEOMETRIC MEAN, HARMONIC MEAN AND THE AM-GM-HM INEQUALITY

For positive values only. Equality holds throughout exactly when all the values are equal. For two positive numbers and : , , , and .

EXAM TIP

Average speed over two EQUAL distances covered at speeds and is (the harmonic mean), not . Average speed is total distance divided by total time, which makes it a weighted mean of the two speeds with the TIMES as weights. Over two equal TIMES it is .

WORKED EXAMPLE

Section P has 30 students with a mean mark of 62, and section Q has 20 students with a mean mark of 72. Later it is found that one mark in section Q was recorded as 48 instead of the correct 84. Find the correct mean mark of all 50 students.

Solution
  1. Work with totals. Total of P . Recorded total of Q .

  2. Recorded combined total .

  3. One mark was recorded too low, so the correct total is .

  4. Correct combined mean .

Answer: 66.72

Spread: range, variance and standard deviation

Two data sets can share a mean and still look very different. For example, 49, 50, 51 and 0, 50, 100 both have mean 50. Measures of dispersion describe how far the values lie from the centre. The range uses only the two extreme values, while the variance and the standard deviation (SD) use every value.

RANGE

Depends only on the two extreme values, so a single outlier changes it.

VARIANCE (POPULATION)

The mean of the squares minus the square of the mean. Convention in these notes: divide by unless the question says 'sample'. The variance is always and is zero only when all values are equal.

SAMPLE VARIANCE

Use it only when a question explicitly asks for the sample variance or sample standard deviation ().

STANDARD DEVIATION AND COEFFICIENT OF VARIATION

The SD is in the same units as the data and is never negative. The CV is used for data with a positive mean. It compares the consistency of data sets with different means: the set with the smaller CV is the more consistent.

VARIANCE OF AN ARITHMETIC PROGRESSION

For terms in AP with common difference . For the first natural numbers this is . The mean and the median of an AP both equal .

COMBINED VARIANCE OF TWO GROUPS

and are the population variances of the two groups, and is the combined mean.

Shifting and scaling. Suppose every observation is transformed as . Adding slides the whole data set without changing its spread. Multiplying by stretches every distance between values by . In the table, is the median and the mode of the original data.

Measure

(shift)

(scale)

Mean

Median

Mode

Range

unchanged

Variance

unchanged

SD

unchanged

EXAM TIP

The SD scales by , never by . For the SD is , not , and the variance scales by . Adding the same number to every value shifts the mean, median and mode by that number but leaves the range, variance and SD unchanged.

EXAM TIP

Adding one new observation equal to the current mean leaves the mean unchanged and changes the (population) variance from to , a decrease unless all the values were equal. The sum of squared deviations stays the same while the count grows by one.

WORKED EXAMPLE

The values 3, 5, 7, 9, 11 are each replaced by . Find the mean, variance, standard deviation and range of the new values.

Solution
  1. The values form an AP with and . So and .

  2. Direct check: the deviations are , their squares sum to , and .

  3. Here and . Mean: .

  4. Variance: . SD: .

  5. Range: . As a check, the new values run from to .

Answer: Mean , variance , SD , range .

Probability: sample space, events and the addition rule

A random experiment has outcomes that cannot be predicted in advance, such as tossing a coin, rolling a die or drawing a card. The sample space is the set of all possible outcomes, and an event is any subset of . When is finite and all its outcomes are equally likely, probability comes down to counting. Convention: give probabilities as exact fractions in lowest terms, and as decimals only when a numerical answer asks for them.

CLASSICAL PROBABILITY

Valid only when is finite and its outcomes are equally likely. Always , and .

COUNTING NOTATION USED IN THESE NOTES

counts selections of items from distinct items when order does not matter; counts arrangements, where order matters. Here and . When no such selection exists, and is taken as .

COMPLEMENT RULE

('not ') contains every outcome of that is outside . Use this rule whenever 'not ' is easier to count than , above all for 'at least one' questions.

ADDITION RULE (TWO EVENTS)

Always true. For mutually exclusive events , so it reduces to .

ADDITION RULE (THREE EVENTS)

Inclusion and exclusion: add the single events, subtract the pairs, then add back the triple.

EXACTLY ONE, AND NEITHER

' only' has probability . 'Neither' means not and not , that is .

ODDS

The odds against are then . Odds compare the chance of with the chance of not (favourable with unfavourable outcomes, when they are equally likely), not with the total.

GEOMETRIC PROBABILITY

For a point chosen uniformly at random from a line segment or a plane region, so that parts of equal length (or area) are equally likely. For example, a point chosen at random inside a square of side 2 lies within distance 1 of the centre of the square with probability .

Working any probability question

  1. Identify the experiment and write down the sample space of EQUALLY LIKELY outcomes. For dice and coins, use ordered outcomes.

  2. Decide whether order matters and whether drawing is with or without replacement.

  3. Count the favourable outcomes, or combine known probabilities with the rules.

  4. Check whether the complement ('none', 'not') is easier to count.

  5. Reduce the fraction to lowest terms and check that it lies between 0 and 1.

WORKED EXAMPLE

One card is drawn at random from a well-shuffled standard deck of 52 cards. Find the probability that it is a king or a heart.

Solution
  1. , and every card is equally likely.

  2. and . The king of hearts is counted in both, so .

  3. .

Answer:

EXAM TIP

The formula needs EQUALLY LIKELY outcomes. The eleven possible totals of two dice, 2 to 12, are not equally likely: a total of 7 can occur in 6 ways but a total of 2 in only 1. So the probability of a total of 7 is , not . Always list the underlying equally likely outcomes, which for two dice are the 36 ordered pairs.

Conditional probability, independence and 'at least one'

Knowing that has happened shrinks the sample space to . The conditional probability is the probability of measured inside that smaller space. Two events are independent if knowing that one has happened does not change the probability of the other.

CONDITIONAL PROBABILITY

With equally likely outcomes this is : count inside only.

MULTIPLICATION RULE

The first form needs and the second , so that the conditional probability is defined. For successive draws: .

INDEPENDENT EVENTS

The second form needs . If and are independent, so are and , and , and and . Successive tosses, rolls, and draws WITH replacement are independent.

Property

Mutually exclusive

Independent

Meaning

Cannot occur together

One occurring does not change the chance of the other

Test

, with

Typical setting

Different outcomes of ONE trial (a die shows 2; the same die shows 5)

Results of SEPARATE trials (first toss a head; second toss a head)

Can they be mutually exclusive AND independent?

Only if or

Only if or

AT LEAST ONE

For INDEPENDENT events with . For independent trials, each with success probability , it becomes . 'At least one' covers exactly one, exactly two, and so on up to all of them.

BINOMIAL PROBABILITY

For independent trials, each with the same success probability (tosses of a coin, rolls of a die, draws WITH replacement). For a fair coin it is .

TOTAL PROBABILITY AND REVERSING A CONDITIONAL PROBABILITY

must be mutually exclusive and exhaustive (exactly one of them happens), with each . The second formula also needs . Use it when a question gives but asks for .

WORKED EXAMPLE

Two fair dice are rolled. Given that the total is at least 9, find the probability that at least one die shows a 6.

Solution
  1. Let be the event 'at least one die shows a 6' and the condition 'total '. Counting ordered pairs, a total of 9 occurs in 4 ways, 10 in 3, 11 in 2 and 12 in 1, so .

  2. Inside , the pairs containing a 6 are (3,6), (6,3), (4,6), (6,4), (5,6), (6,5) and (6,6): 7 pairs. The other three are (4,5), (5,4) and (5,5).

  3. .

  4. For comparison, without the condition . The condition changes the probability, so and are not independent.

Answer:

WORKED EXAMPLE

What is the least number of times a fair die must be rolled so that the probability of getting at least one 6 is more than ?

Solution
  1. The rolls are independent, so . We need , that is, .

  2. decreases as grows, so it is enough to find the first that works. : , which is not below (so and fail too).

  3. : , which is below .

Answer: 4 rolls. The probability of at least one 6 is then .

EXAM TIP

'At least one' means 1 minus P(none). 'At most one' means P(none) + P(exactly one). Both are read inclusively. 'Exactly one' is neither of these.

Dice, coins, cards and drawing without replacement

Many probability questions are built on a few standard experiments. Treat dice, coins and cards as distinguishable even when they look alike. With two dice, (2, 5) and (5, 2) are different outcomes, and with two coins, HT and TH are different outcomes. Counting them separately is what makes the outcomes equally likely.

Experiment

Equally likely outcomes

Counts worth remembering

coins (or tosses of one coin)

Exactly heads: outcomes; at least one head: outcomes

One die

6

Even: 3; odd: 3; prime (2, 3, 5): 3; multiples of 3: 2

Two dice

ordered pairs

Doublets: 6; total 7: 6 ways (the most likely total); total : ways

Three dice

All three equal: 6; all different:

One card from a standard deck

52

4 suits of 13 cards: spades and clubs (black), hearts and diamonds (red); 26 red and 26 black; 4 cards of each rank; 4 aces; 12 face cards (jack, queen, king) unless the question defines face cards differently

cards drawn together from 52

Order does not matter when cards are drawn together

TOTALS OF TWO DICE

Counts ordered pairs, giving 1, 2, 3, 4, 5, 6, 5, 4, 3, 2, 1 ways for totals 2 to 12 (36 in all). Totals and are equally likely.

DRAWING WITHOUT REPLACEMENT

For items drawn together (or one by one without replacement) from items, of which are of type 1. The probability is unless and . WITH replacement, use the binomial formula with instead.

Choosing a method for draws

  1. Drawn TOGETHER (a handful): order does not matter. Count with in both the numerator and the denominator.

  2. Drawn ONE BY ONE without replacement: multiply conditional probabilities, reducing the counts after each draw. When the question does not care about order, this gives the same answer as drawing together.

  3. If a specific ORDER is asked for (first red, then blue), multiply in that order only. If any order is allowed, add the probabilities of all the orders, or use combinations.

  4. WITH replacement: the draws are independent and the probabilities stay the same on every draw.

  5. Convention: 'two balls are drawn' with no further detail means drawn together, that is, without replacement.

WORKED EXAMPLE

A bag contains 5 red, 4 blue and 3 green balls, identical except for colour. Three balls are drawn together at random. Find (i) the probability that all three are of different colours, and (ii) the probability that at least one is red.

Solution
  1. .

  2. (i) Choose one ball of each colour: ways, so .

  3. Check by sequence: any one order, say red, blue, green, has probability . There are orders, giving .

  4. (ii) Use the complement. 'No red' means all three come from the 7 non-red balls: ways. So .

Answer: (i) ; (ii)

EXAM TIP

Symmetry in drawing without replacement: if nothing is known about the other draws, the probability that the 2nd (or the -th) ball drawn is red equals the probability that the 1st is red, . From a bag of 3 red and 5 black balls, , exactly the same as for the first draw.

Expected value

A random variable assigns a number to each outcome: the face shown, the number of heads, or a prize in rupees. Its expected value is the probability-weighted average of its values, which is the long-run average per trial when the experiment is repeated many times. need not be a value that can actually take. The expected face of a fair die is 3.5.

EXPECTED VALUE

, summed over ALL possible values, including zero and negative values such as a loss.

LINEARITY OF EXPECTATION

Holds for any random variables; independence is NOT needed. So the expected total over repeated games is times the expected value of one game.

VARIANCE OF A RANDOM VARIABLE

The same 'mean of the squares minus the square of the mean' idea as for data. For one fair die, , and .

TWO STANDARD EXPECTATIONS

For independent trials with a constant success probability (). The number of successes in trials also has variance . For example, a fair die takes 6 rolls on average to show its first 6.

WORKED EXAMPLE

A player rolls a fair die once. The player receives Rs. 30 if the die shows 6, receives Rs. 12 if it shows 4 or 5, and pays Rs. 9 if it shows 1, 2 or 3. Find the expected gain per game and the expected total gain over 20 games.

Solution
  1. The gain takes the values , and with probabilities , and , which add to 1.

  2. .

  3. By linearity, the expected total over 20 games is .

Answer: Expected gain Rs. 4.50 per game; Rs. 90 over 20 games.

EXAM TIP

A game is FAIR when the expected net gain is zero. If a question gives an entry fee, subtract it from every outcome before calling the game fair or unfair. Subtracting it once from gives the same result, by linearity.

Exam traps and quick checks

EXAM TIP

Mutually exclusive does not mean independent. Two events with non-zero probabilities that cannot occur together are dependent: if one happens, the other's probability drops to 0.

EXAM TIP

Sanity bounds: , and . A value outside these bounds, or outside , signals an error.

EXAM TIP

Count dice and coins as ORDERED outcomes (36 for two dice, for coins), even when the dice or coins are identical in appearance. Listing unordered outcomes such as {2, 5} gives outcomes that are not equally likely.

EXAM TIP

Variance: divide by unless the question says 'sample'. The SD is the positive square root, so never report a negative SD. Shifting all values leaves the variance and SD unchanged, and scaling by multiplies the SD by .

EXAM TIP

Totals shortcut: if values have mean , their total is . Removing a value (with ) gives the new mean . Replacing by changes the mean by .

PREVIOUS-YEAR QUESTIONS

7 questions from the EC, EE and IN papers

Try each question first, then open the answer. One shows the official answer only. We placed each question under a topic ourselves; the exam paper does not label topics.

See these papers in full: GATE ECE 2018 · GATE EE 2025 · GATE EE 2023 · GATE EE 2022 · GATE EE 2018 · GATE IN 2023 · GATE IN 2022

GATE 2025 EE GA Q.8

GATE 2025 · EEGA Q.8 · 2 marks · MCQ

Scores obtained by two students P and Q in seven courses are given in the table below. Based on the information given in the table, which one of the following statements is INCORRECT?

| P | 22 | 89 | 50 | 45 | 78 | 60 | 39 |
|---|---|---|---|---|---|---|---|
| Q | 35 | 65 | 60 | 56 | 81 | 45 | 50 |
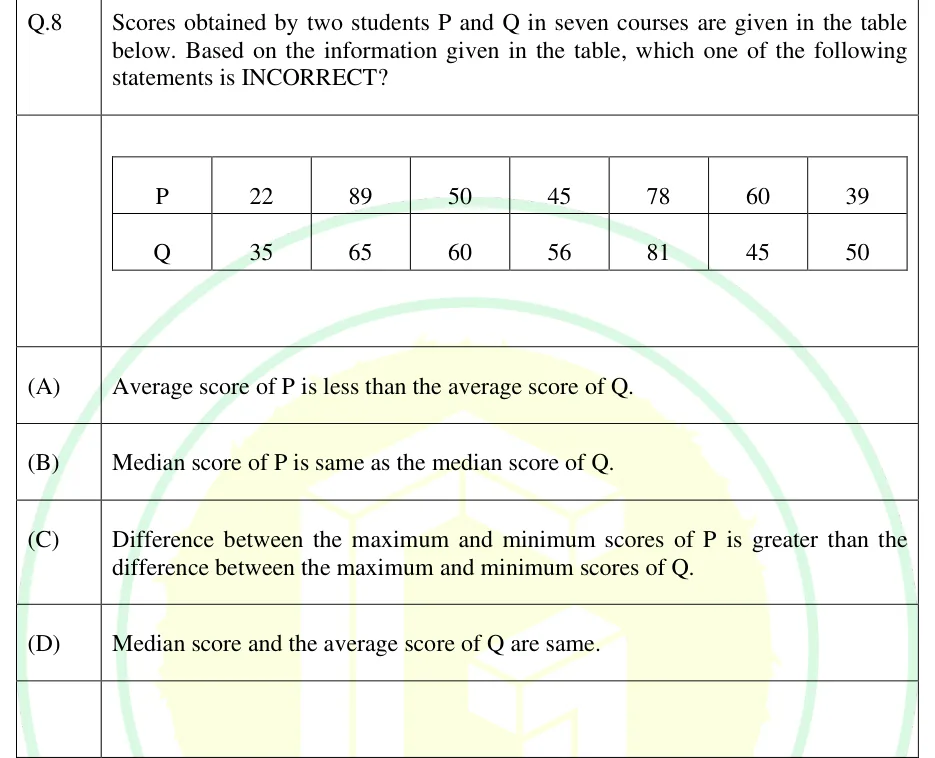
GATE 2025 EE GA question 8: A table with two rows and eight columns, with no header row.Tap to open full size
Figure from the GATE 2025 EE paper. It is part of the question.
Figure description

A table with two rows and eight columns, with no header row. The first column holds the row labels. Row 1, label P: 22, 89, 50, 45, 78, 60, 39. Row 2, label Q: 35, 65, 60, 56, 81, 45, 50. Each column after the first is one of the seven courses, in the same order for both students.

  1. (A)

    Average score of P is less than the average score of Q.

  2. (B)

    Median score of P is same as the median score of Q.

  3. (C)

    Difference between the maximum and minimum scores of P is greater than the difference between the maximum and minimum scores of Q.

  4. (D)

    Median score and the average score of Q are same.
Answer and solution
GATE 2025 EE GA Q.8: answer and solution

GATE 2023 IN GA Q.4

GATE 2023 · INGA Q.4 · 1 mark · MCQ

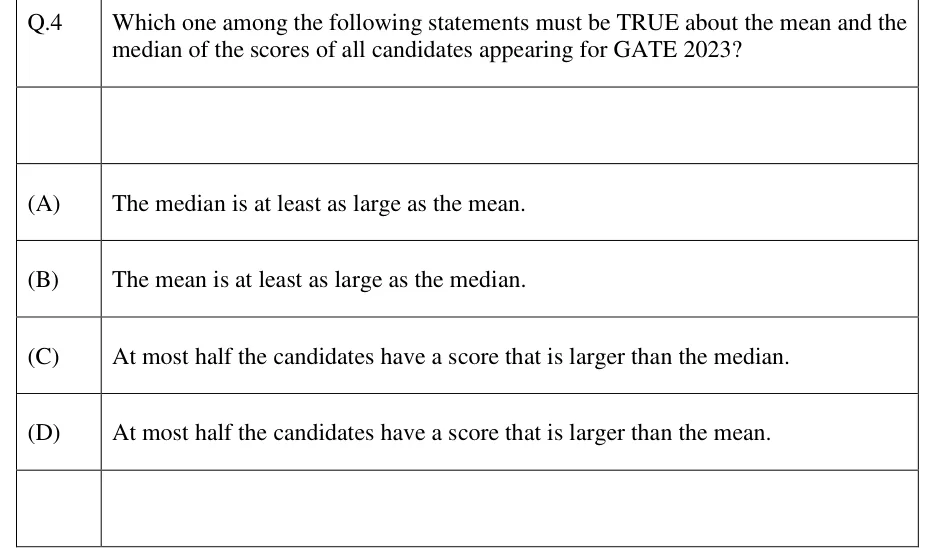
Which one among the following statements must be TRUE about the mean and the median of the scores of all candidates appearing for GATE 2023?

  1. (A)

    The median is at least as large as the mean.

  2. (B)

    The mean is at least as large as the median.

  3. (C)

    At most half the candidates have a score that is larger than the median.

  4. (D)

    At most half the candidates have a score that is larger than the mean.

Answer and solution
See the question in the paper
GATE 2023 IN GA Q.4: answer and solution

GATE 2022 EE GA Q.7

GATE 2022 · EEGA Q.7 · 2 marks · MCQ

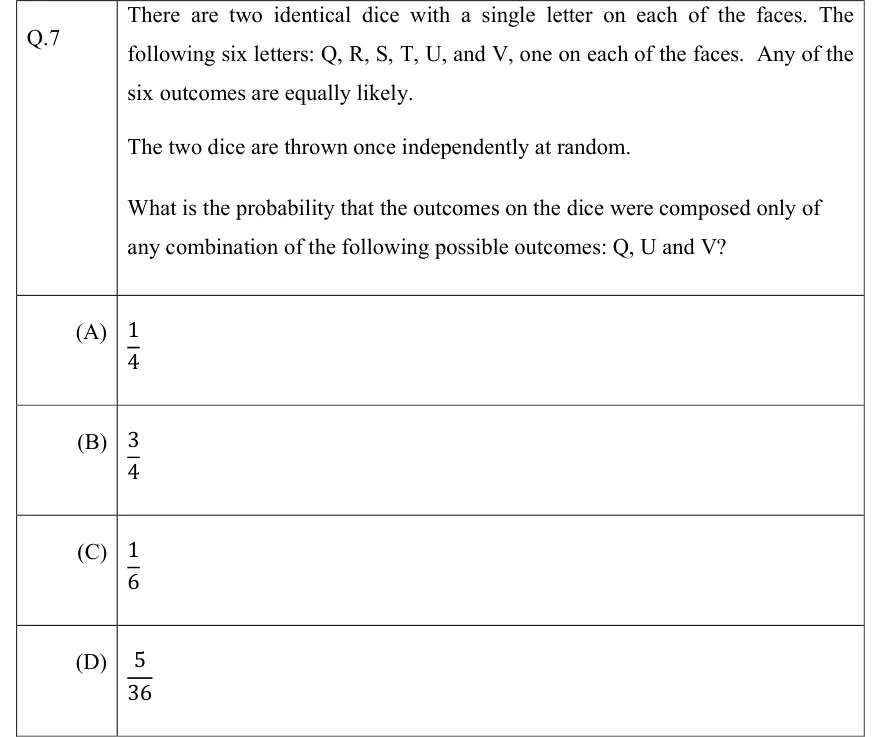
There are two identical dice with a single letter on each of the faces. The following six letters: Q, R, S, T, U, and V, one on each of the faces. Any of the six outcomes are equally likely.

The two dice are thrown once independently at random.

What is the probability that the outcomes on the dice were composed only of any combination of the following possible outcomes: Q, U and V?

  1. (A)

  2. (B)

  3. (C)

  4. (D)

Answer and solution
See the question in the paper
GATE 2022 EE GA Q.7: answer and solution

GATE 2022 IN GA Q.7

GATE 2022 · INGA Q.7 · 2 marks · MCQ

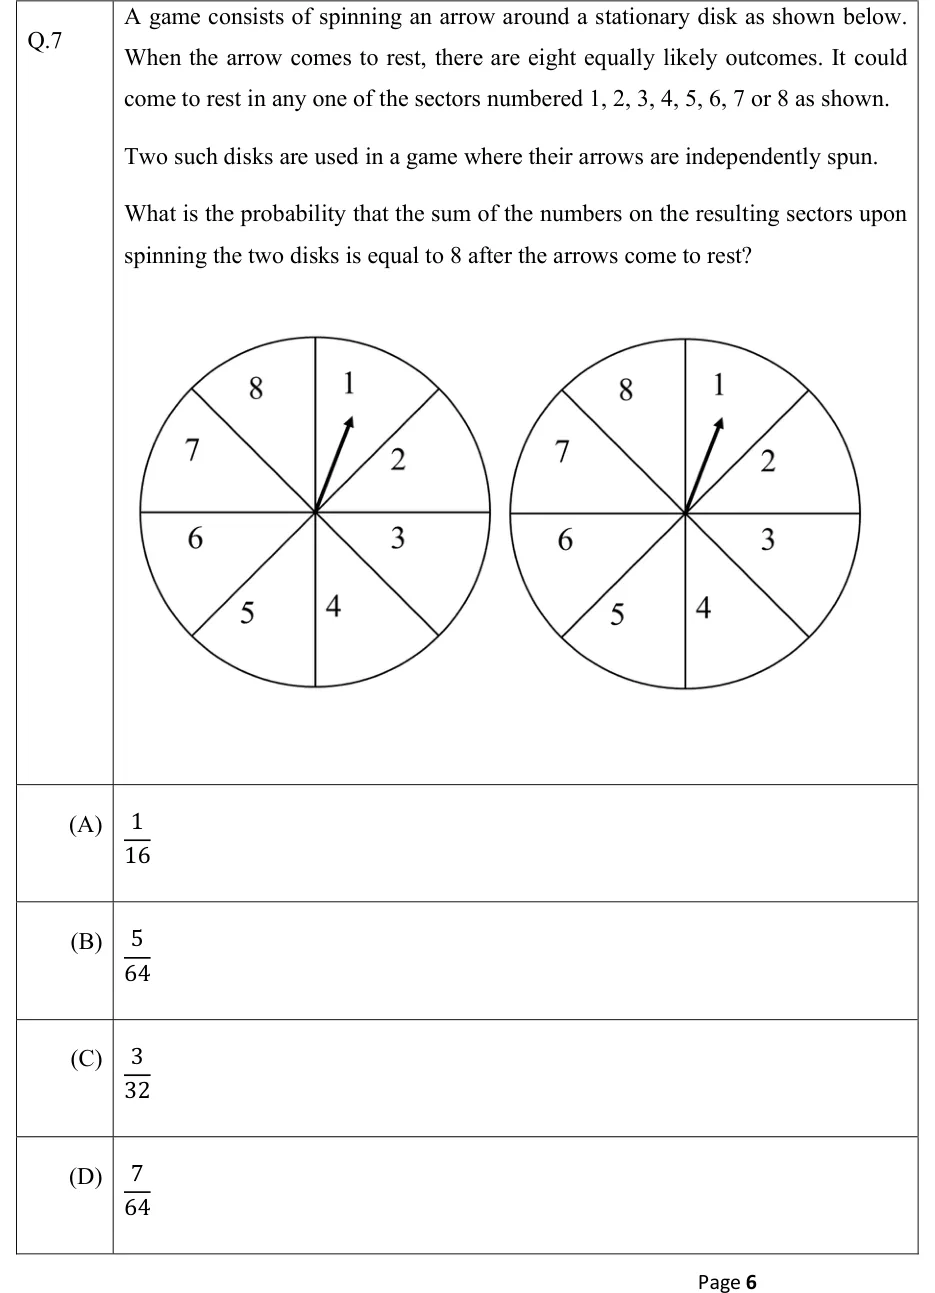
A game consists of spinning an arrow around a stationary disk as shown below. When the arrow comes to rest, there are eight equally likely outcomes. It could come to rest in any one of the sectors numbered 1, 2, 3, 4, 5, 6, 7 or 8 as shown.

Two such disks are used in a game where their arrows are independently spun.

What is the probability that the sum of the numbers on the resulting sectors upon spinning the two disks is equal to 8 after the arrows come to rest?

GATE 2022 IN GA question 7: Two identical circular disks drawn side by side.Tap to open full size
Figure from the GATE 2022 IN paper. It is part of the question.
Figure description

Two identical circular disks drawn side by side. Each circle is divided into 8 equal sectors (45 degrees each) by four straight lines through the centre: one vertical, one horizontal and two diagonals at 45 degrees. The sectors are numbered clockwise starting just right of the top of the vertical line: 1 (top, between the vertical line and the upper-right diagonal), 2 (between the upper-right diagonal and the horizontal line, right side), 3 (between the horizontal line and the lower-right diagonal), 4 (between the lower-right diagonal and the bottom of the vertical line), 5 (between the bottom of the vertical line and the lower-left diagonal), 6 (between the lower-left diagonal and the horizontal line, left side), 7 (between the horizontal line and the upper-left diagonal), 8 (between the upper-left diagonal and the top of the vertical line). In each disk a single arrow starts at the centre and points up and slightly to the right, into sector 1. No shading.

  1. (A)

  2. (B)

  3. (C)

  4. (D)

Answer and solution
GATE 2022 IN GA Q.7: answer and solution

GATE 2018 EC GA Q.9

GATE 2018 · ECGA Q.9 · 2 marks · MCQ

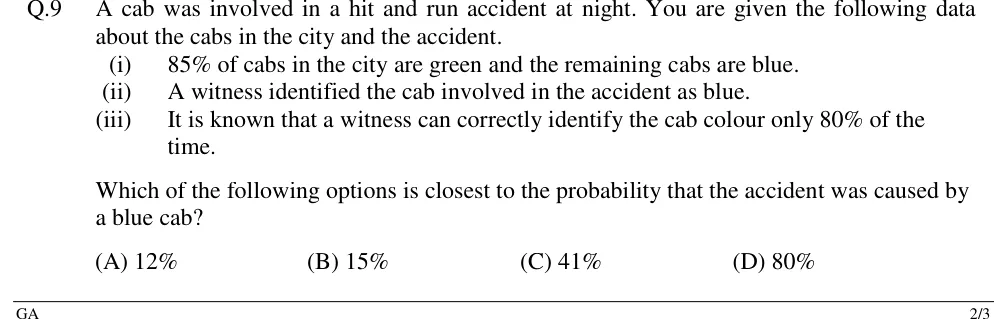
A cab was involved in a hit and run accident at night. You are given the following data about the cabs in the city and the accident.

(i) 85% of cabs in the city are green and the remaining cabs are blue.

(ii) A witness identified the cab involved in the accident as blue.

(iii) It is known that a witness can correctly identify the cab colour only 80% of the time.

Which of the following options is closest to the probability that the accident was caused by a blue cab?

  1. (A)

    12%

  2. (B)

    15%

  3. (C)

    41%

  4. (D)

    80%

Answer and solution
See the question in the paper
GATE 2018 EC GA Q.9: answer and solution

GATE 2018 EE GA Q.8

GATE 2018 · EEGA Q.8 · 2 marks · MCQ

A class of twelve children has two more boys than girls. A group of three children are randomly picked from this class to accompany the teacher on a field trip. What is the probability that the group accompanying the teacher contains more girls than boys?

  1. (A)

    0

  2. (B)

  3. (C)

  4. (D)

Official answer

Official answer: marks to all candidatesSource: Official answer key, GATE 2018 EE (IIT Guwahati)

See the question in the paper
GATE 2018 EE GA Q.8: official answer

PRACTICE

5 questions to test yourself

PRACTICE 11 mark · NAT

In an assessment, Paper I carries weight 2, Paper II carries weight 3 and Paper III carries weight 5. A candidate scores 72, 60 and 85 (each out of 100) in Papers I, II and III respectively. The candidate's weighted mean score is ______ (rounded off to one decimal place).

Answer and solution

Answer: (accepted range )

  1. Weighted mean .

  2. .

PRACTICE 21 mark · MCQ

A data set has mean 10 and variance 9. Every value in the set is replaced by . The mean and the standard deviation of the new data set are

  1. (A)

    mean , standard deviation

  2. (B)

    mean , standard deviation

  3. (C)

    mean , standard deviation

  4. (D)

    mean , standard deviation

Answer and solution

Answer: (B)

  1. For with and : .

  2. , so . The SD is never negative, and 36 is the variance, not the SD.

  3. The answer is (B).

PRACTICE 32 marks · NAT

A bag contains 4 red and 6 black balls, identical except for colour. Two balls are drawn at random, one after the other, without replacement. Given that the second ball drawn is red, the probability that the first ball drawn was red is ______ (rounded off to two decimal places).

Answer and solution

Answer: (accepted range )

  1. .

  2. . This equals , as the symmetry of draws predicts.

  3. .

PRACTICE 42 marks · MCQ

A player tosses a fair coin at most three times and stops at the first head. The player receives Rs. 8 if the first head appears on the first toss, Rs. 4 if it appears on the second toss and Rs. 2 if it appears on the third toss. The player pays Rs. 10 if no head appears in the three tosses. The expected gain of the player per game, in rupees, is

  1. (A)

    1.00

  2. (B)

    4.00

  3. (C)

    5.25

  4. (D)

    6.50

Answer and solution

Answer: (B)

  1. P(first head on toss 1) ; on toss 2 ; on toss 3 . P(no head in three tosses) . These add to 1.

  2. .

  3. The answer is Rs. 4.00, option (B). Leaving out the loss gives the trap value 5.25, and treating the four cases as equally likely gives 1.00.

PRACTICE 52 marks · MSQ

For two events and , , and . Which of the following statements is/are CORRECT?

  1. (A)

    and are independent.

  2. (B)

    and are mutually exclusive.

  3. (C)

  4. (D)

    The probability that neither nor occurs is .

Answer and solution

Answer: (A), (C)

  1. By the addition rule, .

  2. , so and are independent: (A) is correct.

  3. , so they are not mutually exclusive: (B) is wrong.

  4. : (C) is correct.

  5. , not : (D) is wrong.

OFFICIAL GATE 2027 SYLLABUS WORDING

Copied from the GATE 2027 syllabus; see all 2027 syllabi.

EVERY GATE PAPER

Elementary statistics and probability

Preparing in Kolkata? See IAE Academy’s GATE courses.