
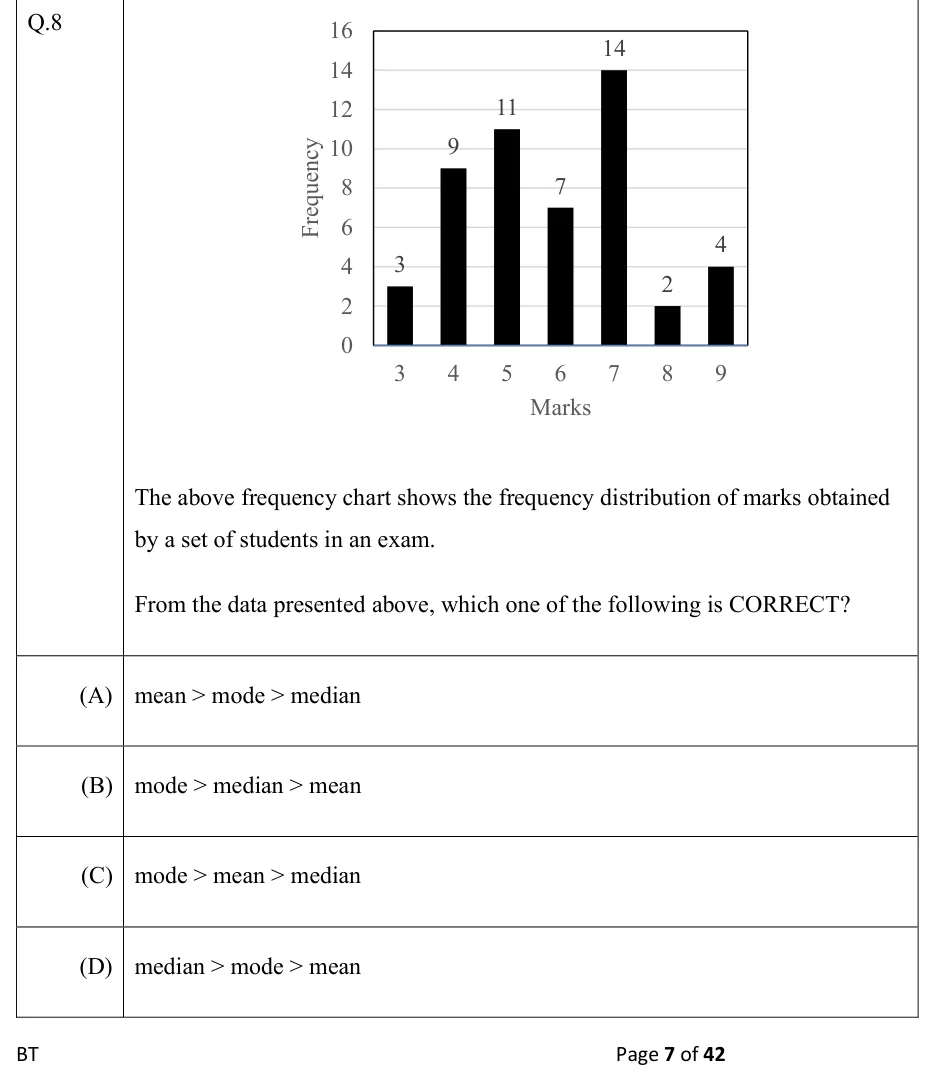
The above frequency chart shows the frequency distribution of marks obtained by a set of students in an exam.
From the data presented above, which one of the following is CORRECT?
 Tap to open full size
Figure description
A vertical bar chart with black bars. X-axis labelled 'Marks' with values 3, 4, 5, 6, 7, 8, 9. Y-axis labelled 'Frequency' from 0 to 16 in steps of 2, with light horizontal gridlines. Bar heights, labelled above each bar: marks 3 has frequency 3; marks 4 has 9; marks 5 has 11; marks 6 has 7; marks 7 has 14; marks 8 has 2; marks 9 has 4.
- (A)
mean > mode > median
- (B)
mode > median > mean
- (C)
mode > mean > median
- (D)
median > mode > mean