
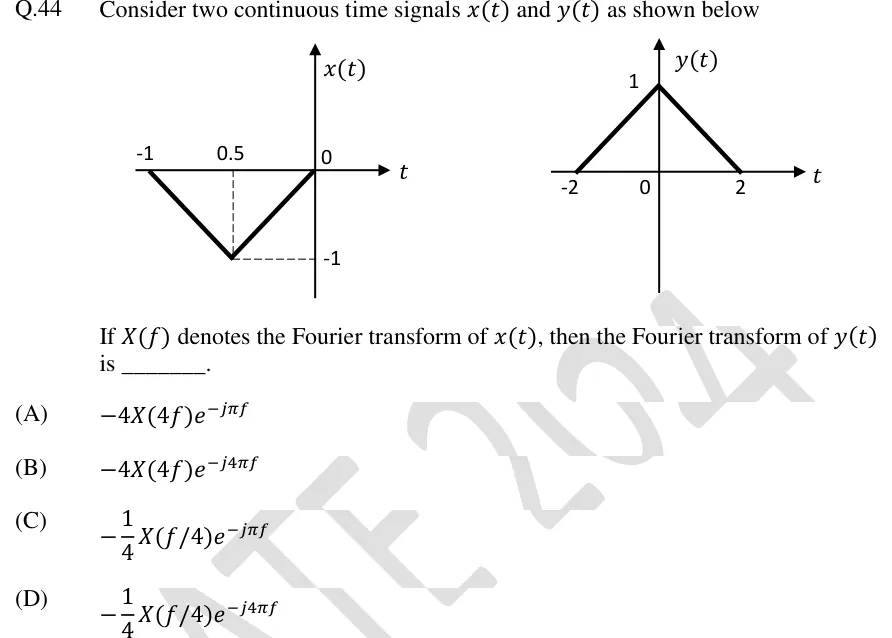
Consider two continuous time signals and as shown below
[Figure: and ]
If denotes the Fourier transform of , then the Fourier transform of is ______.
 Tap to open full size
Figure description
Two sketches side by side. Left: x(t) versus t. It is an inverted triangle lying entirely below the axis: it is 0 at t = -1, falls linearly to a minimum of -1, then rises linearly back to 0 at t = 0, and is zero outside [-1, 0]. The minimum sits exactly halfway between -1 and 0, marked by a vertical dashed line down from a tick labelled '0.5' (printed without a minus sign, though its position is t = -0.5) and a horizontal dashed line across to the level labelled -1 on the vertical axis. The origin is labelled 0. Right: y(t) versus t. It is an upright triangle: 0 at t = -2, rising linearly to a peak of 1 at t = 0, falling linearly to 0 at t = 2, and zero outside [-2, 2]. The ticks are labelled -2, 0, 2 on the t-axis and 1 on the vertical axis.
- (A)
- (B)
- (C)
- (D)