
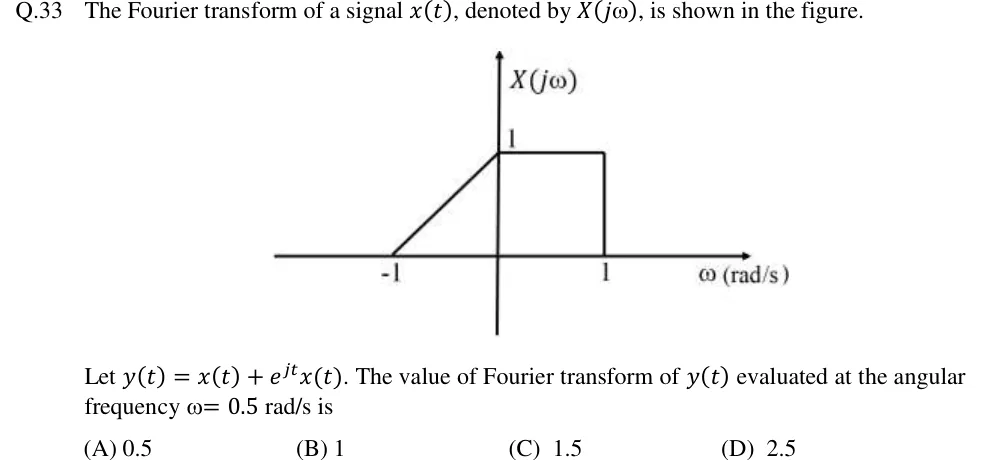
The Fourier transform of a signal , denoted by , is shown in the figure.
Let . The value of Fourier transform of evaluated at the angular frequency rad/s is
 Tap to open full size
Figure description
Plot of X(j ω) (vertical axis) against ω in rad/s (horizontal axis). X(j ω) = 0 for ω < -1. From ω = -1 it rises linearly (a straight ramp) to the value 1 at ω = 0 (the value 1 is marked on the vertical axis). It then stays flat at 1 from ω = 0 to ω = 1, and drops vertically to 0 at ω = 1. X(j ω) = 0 for ω > 1. Labelled ticks on the horizontal axis: -1 and 1.
- (A)
0.5
- (B)
1
- (C)
1.5
- (D)
2.5