
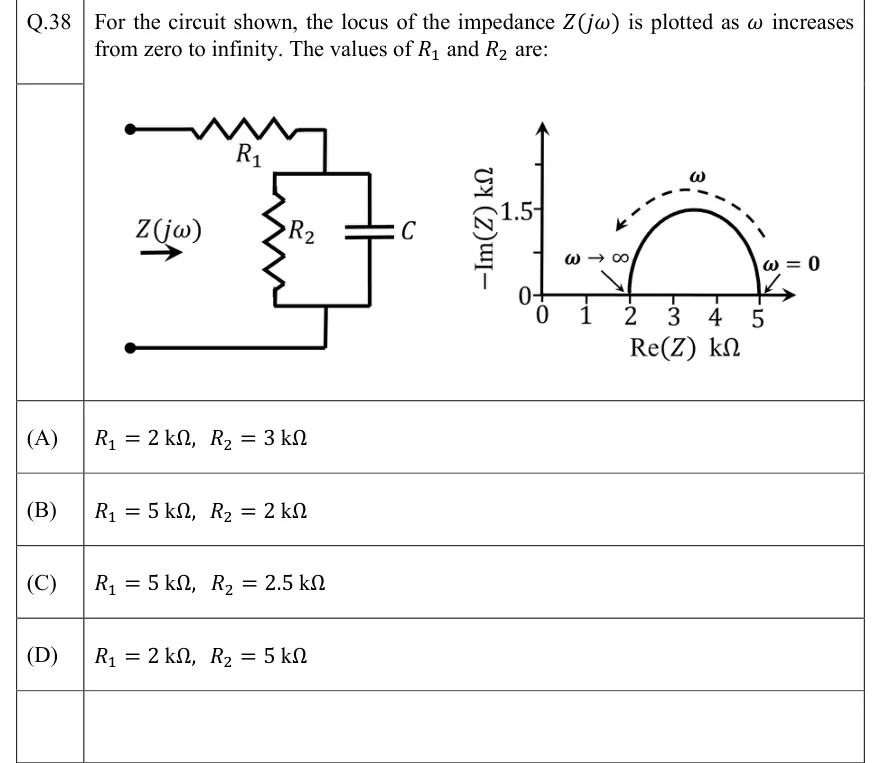
For the circuit shown, the locus of the impedance is plotted as increases from zero to infinity. The values of and are:
 Tap to open full size
Figure description
Left: a two-terminal network seen from the input, labelled Z(j ω) with an arrow pointing into it. From the top input terminal, resistor R_1 runs in series to a node; between that node and the bottom input terminal (a plain wire back to the bottom terminal) are two branches in parallel: resistor R_2 and capacitor C. So Z = R_1 + (R_2 C). Right: impedance locus plot with horizontal axis Re(Z) in k Ω (ticks 0, 1, 2, 3, 4, 5) and vertical axis -Im(Z) in k Ω (ticks 0 and 1.5). The locus is a semicircle above the real axis, starting at Re(Z) = 5 k Ω (labelled ω = 0) and ending at Re(Z) = 2 k Ω (labelled ω → ∞), with its top at -Im(Z) = 1.5 k Ω; a dashed arrow labelled ω runs along the arc from the right end to the left end, showing the direction of increasing ω.
- (A)
- (B)
- (C)
- (D)