
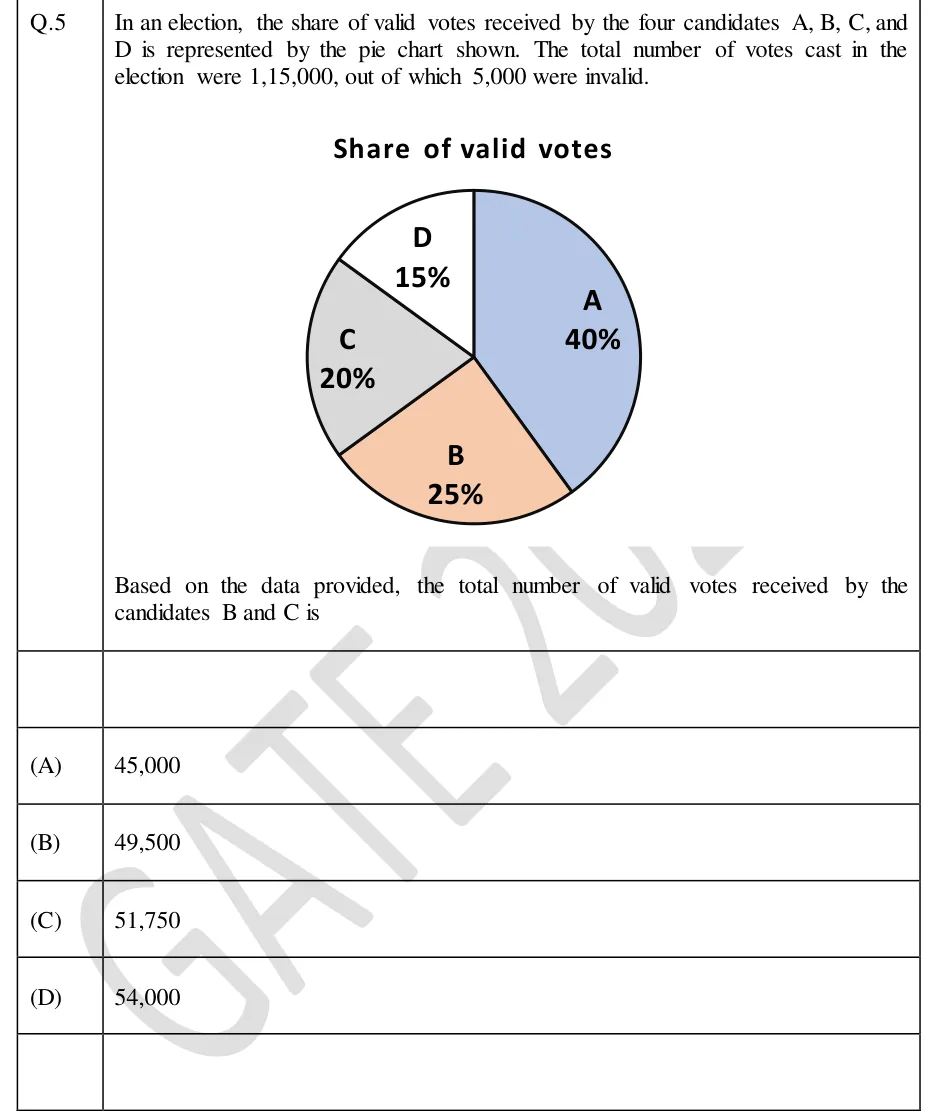
In an election, the share of valid votes received by the four candidates A, B, C, and D is represented by the pie chart shown. The total number of votes cast in the election were 1,15,000, out of which 5,000 were invalid.
Based on the data provided, the total number of valid votes received by the candidates B and C is
 Tap to open full size
Figure description
A pie chart titled "Share of valid votes" with four sectors: A (blue, right side) 40%, B (orange/peach, bottom) 25%, C (grey, left) 20%, D (white, top-left) 15%. Each sector is labelled with its candidate letter and percentage.
- (A)
45,000
- (B)
49,500
- (C)
51,750
- (D)
54,000