
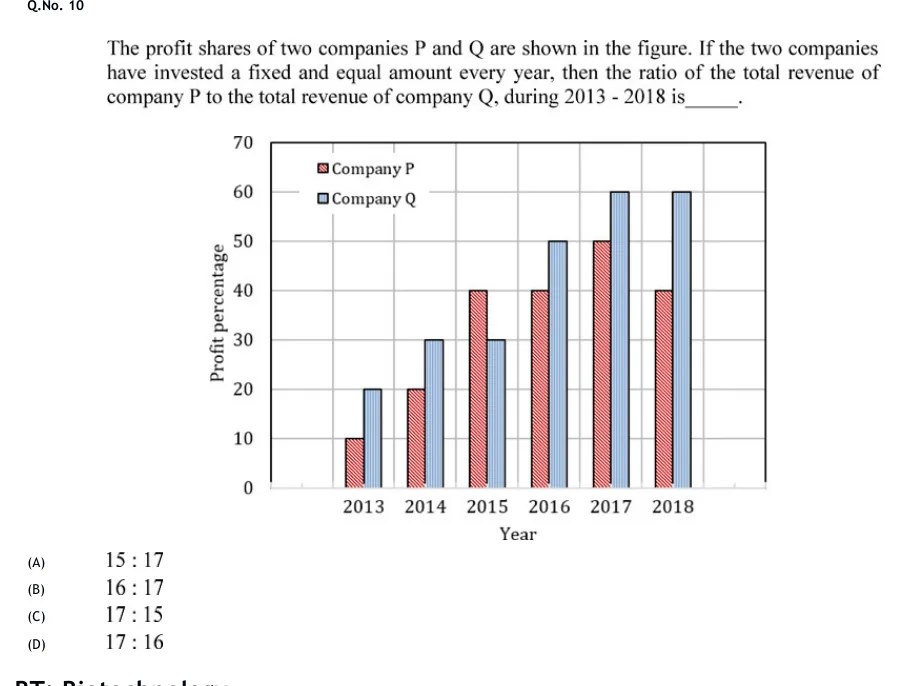
The profit shares of two companies P and Q are shown in the figure. If the two companies have invested a fixed and equal amount every year, then the ratio of the total revenue of company P to the total revenue of company Q, during 2013 - 2018 is______.
 Tap to open full size
Figure description
Clustered vertical bar chart. Title-less; x-axis 'Year' with 2013, 2014, 2015, 2016, 2017, 2018; y-axis 'Profit percentage' from 0 to 70 in steps of 10 with horizontal gridlines. Legend at top: Company P (red diagonal-hatched bar), Company Q (blue vertical-hatched bar). Each year has a red P bar on the left and a blue Q bar on the right. Values P: 2013 = 10, 2014 = 20, 2015 = 40, 2016 = 40, 2017 = 50, 2018 = 40. Values Q: 2013 = 20, 2014 = 30, 2015 = 30, 2016 = 50, 2017 = 60, 2018 = 60.
- (A)
15 : 17
- (B)
16 : 17
- (C)
17 : 15
- (D)
17 : 16