
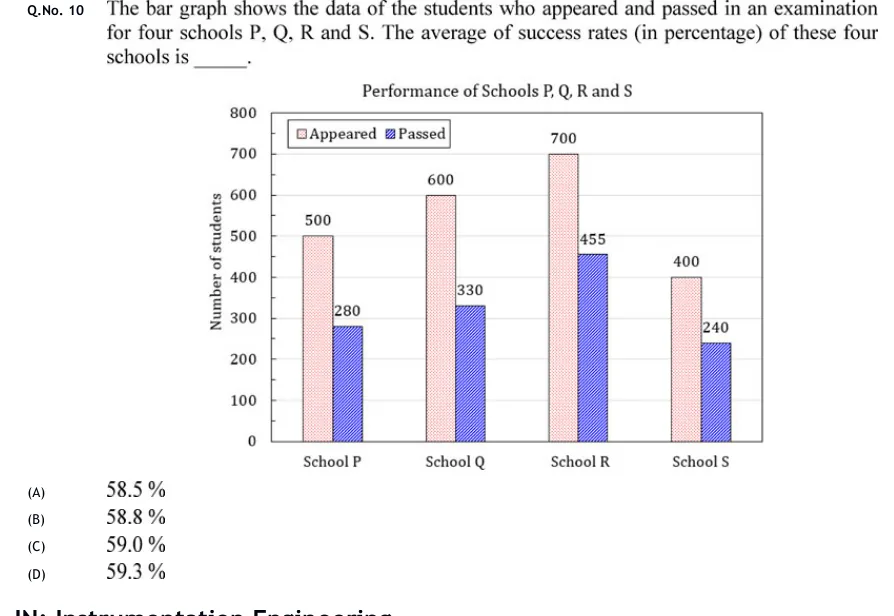
The bar graph shows the data of the students who appeared and passed in an examination for four schools P, Q, R and S. The average of success rates (in percentage) of these four schools is ______.
 Tap to open full size
Figure description
Grouped (clustered) vertical bar chart titled "Performance of Schools P, Q, R and S". Vertical axis labelled "Number of students", scale 0 to 800 in steps of 100, with light horizontal gridlines. Horizontal axis has four categories, left to right: School P, School Q, School R, School S. Legend at top left inside the plot: "Appeared" (light pink, finely dotted fill) and "Passed" (blue, diagonally hatched fill). Each school has two adjacent bars, Appeared on the left and Passed on the right, each with its value printed above or at the top of the bar. School P: Appeared 500, Passed 280. School Q: Appeared 600, Passed 330. School R: Appeared 700, Passed 455. School S: Appeared 400, Passed 240.
- (A)
58.5 %
- (B)
58.8 %
- (C)
59.0 %
- (D)
59.3 %