
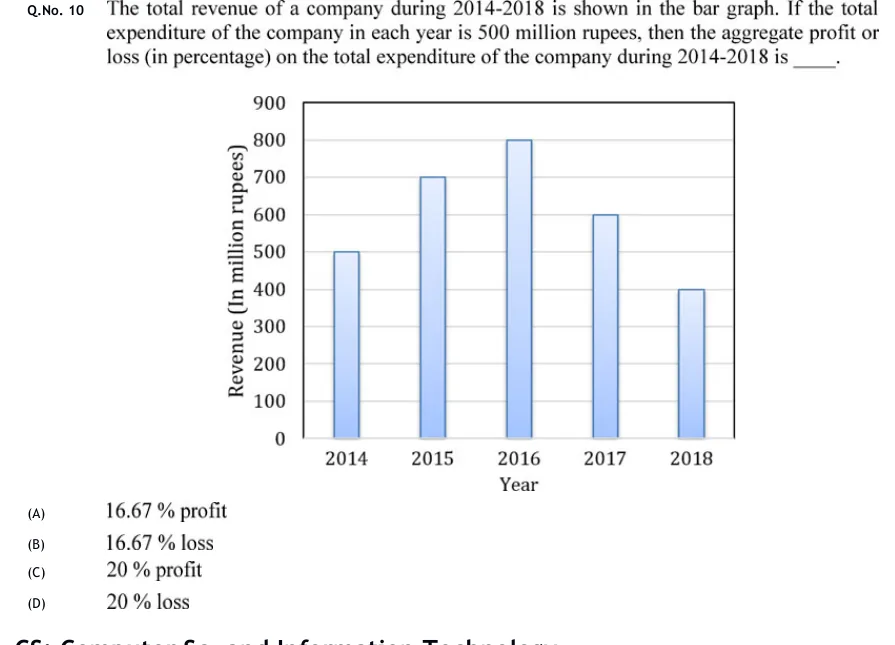
The total revenue of a company during 2014-2018 is shown in the bar graph. If the total expenditure of the company in each year is 500 million rupees, then the aggregate profit or loss (in percentage) on the total expenditure of the company during 2014-2018 is ______.
 Tap to open full size
Figure description
Vertical bar chart. Y-axis titled 'Revenue (In million rupees)' with ticks 0, 100, 200,..., 900. X-axis titled 'Year' with five bars: 2014 = 500, 2015 = 700, 2016 = 800, 2017 = 600, 2018 = 400. Bars are light blue with a gradient, thin, evenly spaced, gridlines at each 100.
- (A)
16.67 % profit
- (B)
16.67 % loss
- (C)
20 % profit
- (D)
20 % loss