
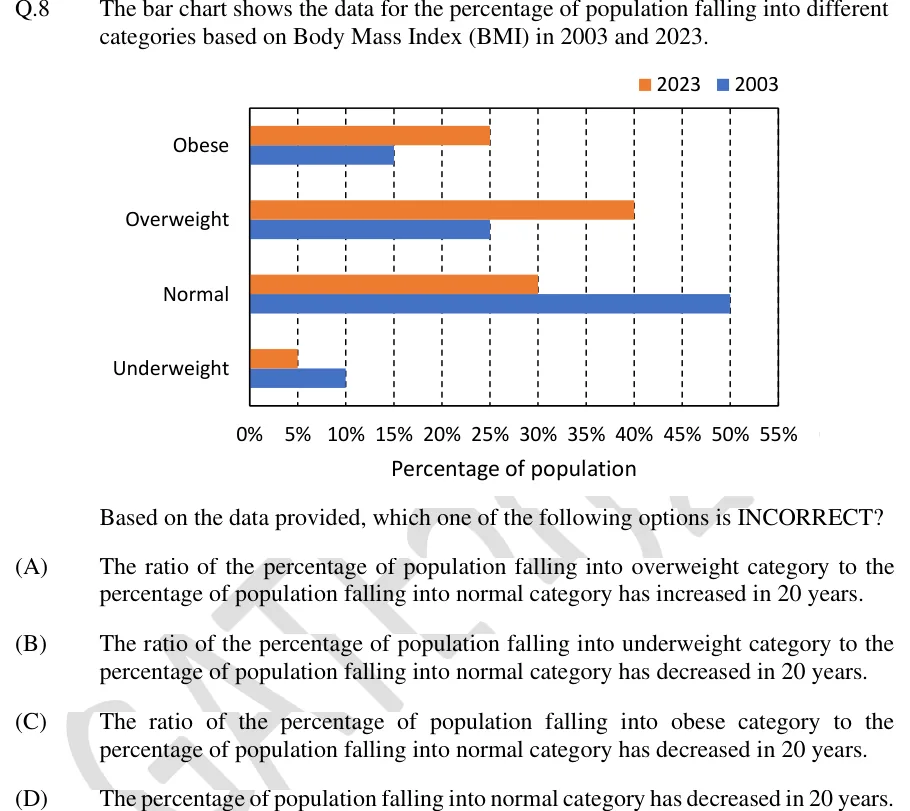
The bar chart shows the data for the percentage of population falling into different categories based on Body Mass Index (BMI) in 2003 and 2023.
[Bar chart]
Based on the data provided, which one of the following options is INCORRECT?
 Tap to open full size
Figure description
Horizontal clustered bar chart. Legend at top right: orange square = 2023, blue square = 2003. Vertical axis lists four BMI categories, top to bottom: Obese, Overweight, Normal, Underweight. Each category has two horizontal bars, the orange (2023) bar above the blue (2003) bar, both starting at 0%. Horizontal axis titled 'Percentage of population', labelled 0%, 5%, 10%, 15%, 20%, 25%, 30%, 35%, 40%, 45%, 50%, 55%, with dashed vertical gridlines at every 5%. Bar values (each ends exactly on a gridline): Obese: 2023 = 25%, 2003 = 15%. Overweight: 2023 = 40%, 2003 = 25%. Normal: 2023 = 30%, 2003 = 50%. Underweight: 2023 = 5%, 2003 = 10%. Each year's four values sum to 100%.
- (A)
The ratio of the percentage of population falling into overweight category to the percentage of population falling into normal category has increased in 20 years.
- (B)
The ratio of the percentage of population falling into underweight category to the percentage of population falling into normal category has decreased in 20 years.
- (C)
The ratio of the percentage of population falling into obese category to the percentage of population falling into normal category has decreased in 20 years.
- (D)
The percentage of population falling into normal category has decreased in 20 years.