
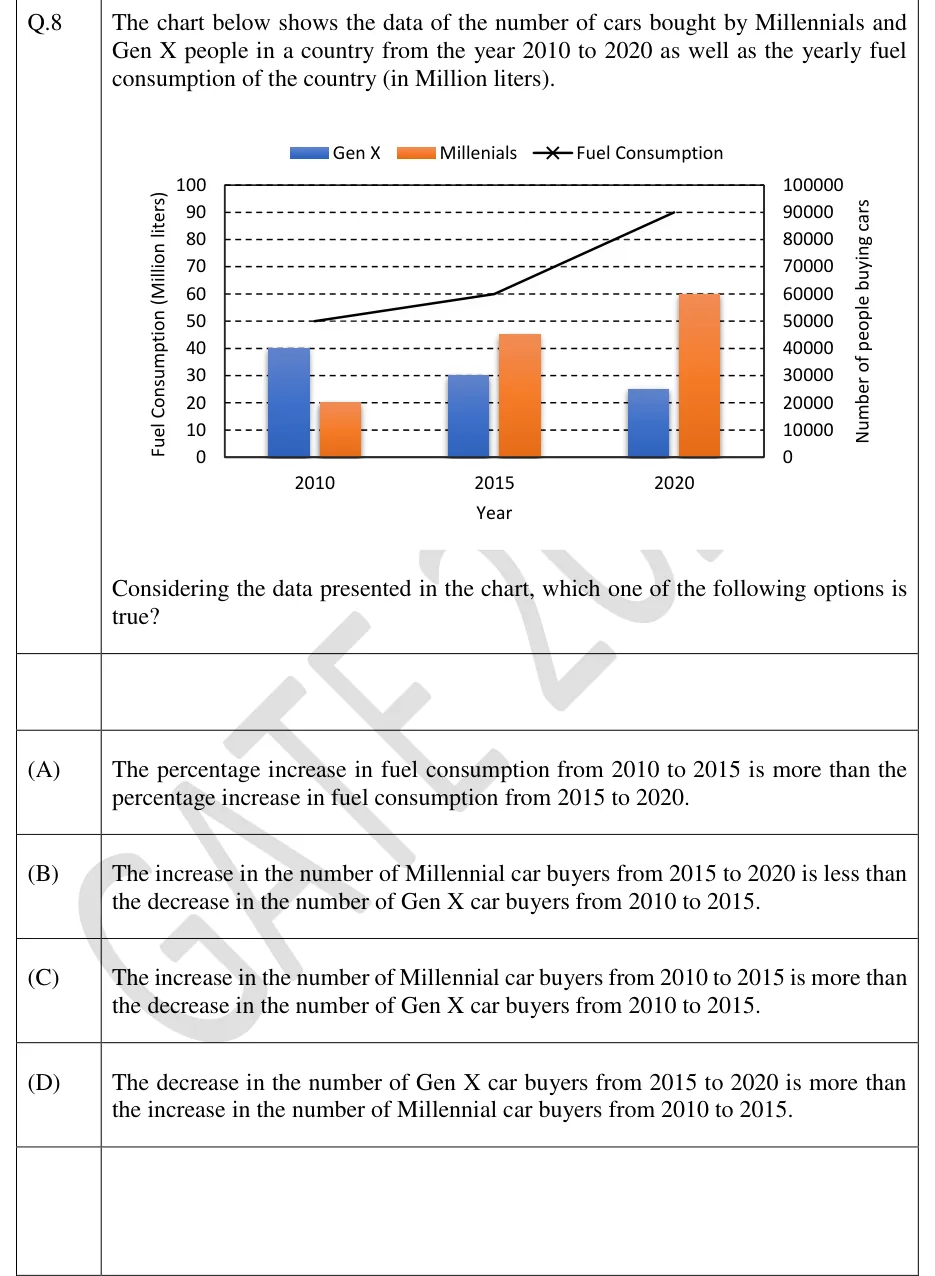
The chart below shows the data of the number of cars bought by Millennials and Gen X people in a country from the year 2010 to 2020 as well as the yearly fuel consumption of the country (in Million liters).
[Chart]
Considering the data presented in the chart, which one of the following options is true?
 Tap to open full size
Figure description
Combined clustered-bar and line chart. Legend at top: blue bar = "Gen X", orange bar = "Millenials" (spelled this way in the legend), black line with x markers = "Fuel Consumption". Horizontal axis titled "Year" with three categories: 2010, 2015, 2020. Left vertical axis titled "Fuel Consumption (Million liters)", scale 0 to 100 in steps of 10. Right vertical axis titled "Number of people buying cars", scale 0 to 100000 in steps of 10000. Dashed horizontal gridlines at every step. Bars read on the right axis: 2010 - Gen X 40000, Millennials 20000; 2015 - Gen X 30000, Millennials 45000; 2020 - Gen X 25000, Millennials 60000. Fuel consumption line read on the left axis: 2010 = 50, 2015 = 60, 2020 = 90 (Million liters), drawn as straight segments from 50 to 60 to 90.
- (A)
The percentage increase in fuel consumption from 2010 to 2015 is more than the percentage increase in fuel consumption from 2015 to 2020.
- (B)
The increase in the number of Millennial car buyers from 2015 to 2020 is less than the decrease in the number of Gen X car buyers from 2010 to 2015.
- (C)
The increase in the number of Millennial car buyers from 2010 to 2015 is more than the decrease in the number of Gen X car buyers from 2010 to 2015.
- (D)
The decrease in the number of Gen X car buyers from 2015 to 2020 is more than the increase in the number of Millennial car buyers from 2010 to 2015.