
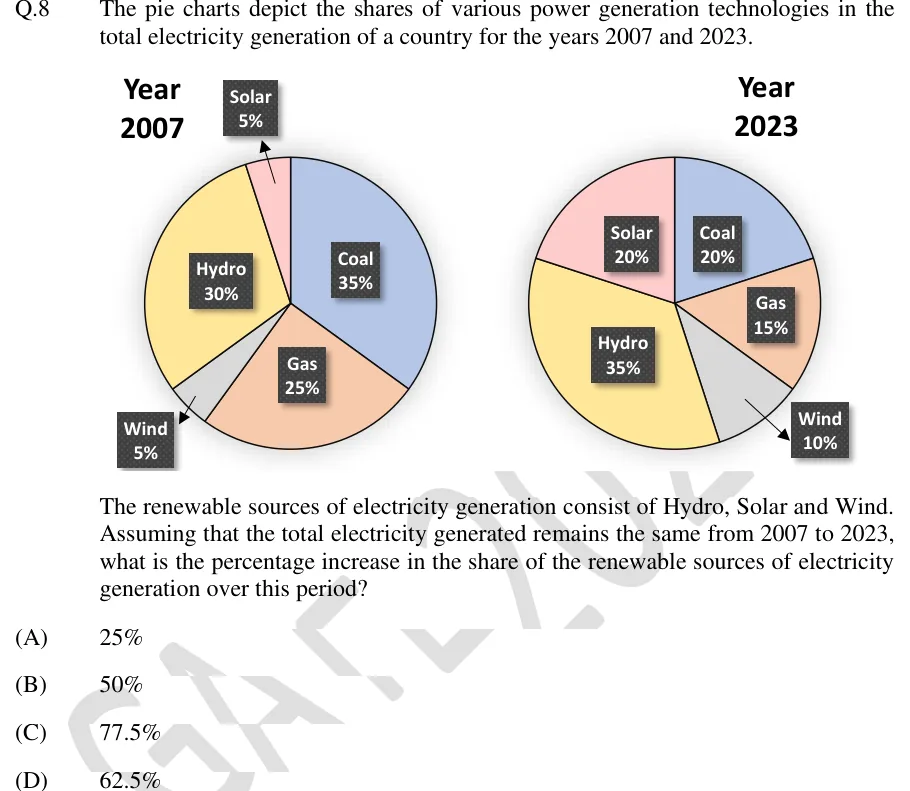
The pie charts depict the shares of various power generation technologies in the total electricity generation of a country for the years 2007 and 2023.
The renewable sources of electricity generation consist of Hydro, Solar and Wind. Assuming that the total electricity generated remains the same from 2007 to 2023, what is the percentage increase in the share of the renewable sources of electricity generation over this period?
 Tap to open full size
Figure description
Two pie charts side by side with labelled percentage shares. Left chart, titled 'Year 2007': Coal 35% (blue, right side), Gas 25% (orange, lower), Wind 5% (grey, lower left, label outside with arrow), Hydro 30% (yellow, left), Solar 5% (pink, top, label outside with arrow). Right chart, titled 'Year 2023': Coal 20% (blue, upper right), Gas 15% (orange, right), Wind 10% (grey, lower right, label outside with arrow), Hydro 35% (yellow, left and bottom), Solar 20% (pink, upper left).
- (A)
25%
- (B)
50%
- (C)
77.5%
- (D)
62.5%