
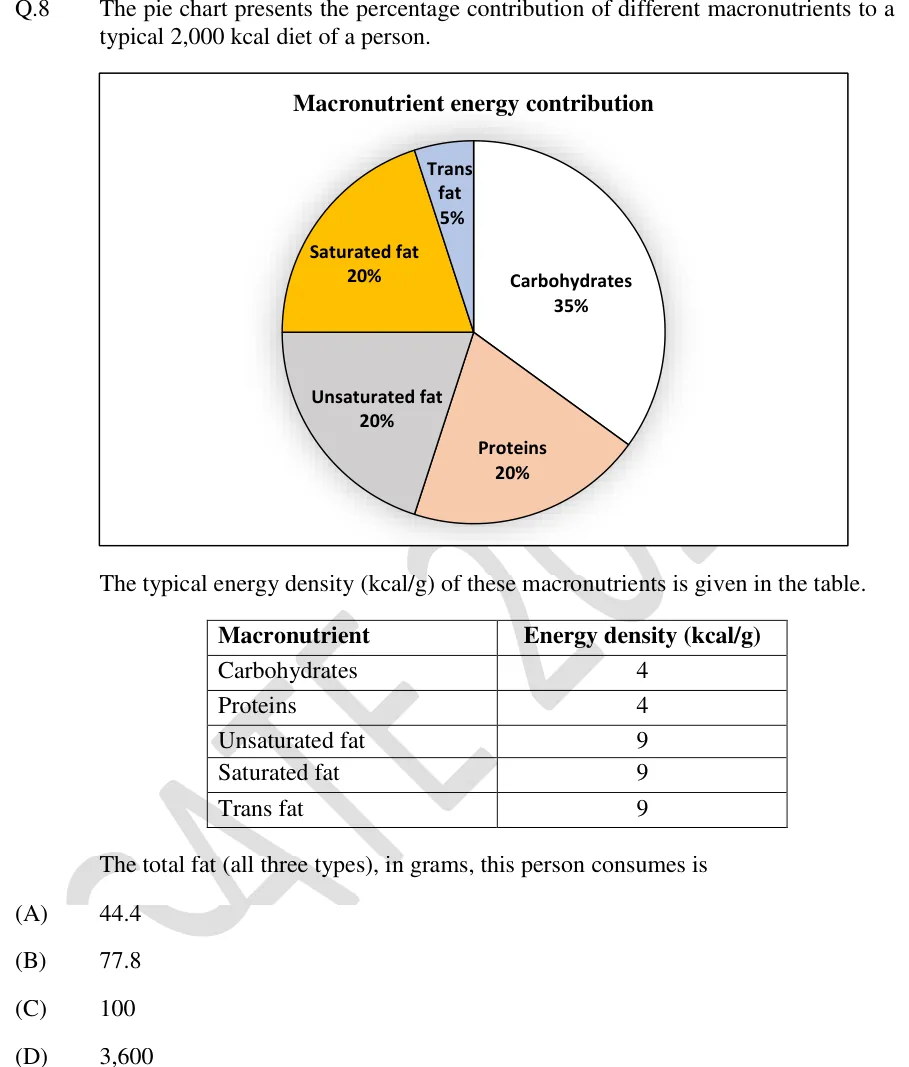
The pie chart presents the percentage contribution of different macronutrients to a typical 2,000 kcal diet of a person.
The typical energy density (kcal/g) of these macronutrients is given in the table.
The total fat (all three types), in grams, this person consumes is
 Tap to open full size
Figure description
A pie chart titled "Macronutrient energy contribution" in a bordered box. Five sectors: Carbohydrates 35% (white, right side, starting at the top and running clockwise), Proteins 20% (light orange/peach, lower right), Unsaturated fat 20% (grey, lower left), Saturated fat 20% (yellow/amber, upper left), Trans fat 5% (light blue, small sector at top just left of the vertical line). Each sector is labelled with its name and percentage. Below the chart is a table with columns "Macronutrient" and "Energy density (kcal/g)": Carbohydrates 4; Proteins 4; Unsaturated fat 9; Saturated fat 9; Trans fat 9.
- (A)
44.4
- (B)
77.8
- (C)
100
- (D)
3,600