IAE Academy

GATE BT

Electrophoresis and assays

Electrophoresis, microarrays, immunoassays and flow cytometry

Notes for GATE BT on Electrophoresis, Microarrays, Immunoassays and Flow Cytometry. Covers agarose and polyacrylamide gels (SDS-PAGE, native PAGE, the discontinuous system), isoelectric focusing and 2-D gels, DNA microarrays, enzyme activity assays (units, specific activity, purification tables), ELISA formats, RIA, immunohistochemistry and blotting, flow cytometry and FACS, and whole-genome and ChIP sequencing. Includes three worked examples and six practice questions.

9 previous-year questions · 9 solved · 6 practice questions

Electrophoresis: principle and choosing a matrix

Electrophoresis separates charged molecules by how they move through a matrix under an applied electric field. At the near-neutral to slightly alkaline pH of nucleic acid gels, every phosphate in DNA or RNA is negatively charged, so nucleic acids move toward the anode (positive electrode). Migration depends on the molecule's charge, its size and shape, and the pore size of the matrix, which acts as a molecular sieve.

Agarose gels have large pores. They are used mainly for nucleic acid fragments from about 100 bp to tens of kb.

Polyacrylamide gels are acrylamide cross-linked with N,N'-methylenebisacrylamide and polymerised by ammonium persulfate and TEMED. Their pores are smaller and are set by the acrylamide percentage and the cross-linker ratio. They are used for proteins and for short nucleic acids, and give finer size resolution.

ELECTROPHORETIC MOBILITY (IDEALISED, FREE SOLUTION)

is the velocity per unit field strength . is the net charge, the viscosity of the medium and the hydrodynamic radius. The second equality is an idealisation: it assumes a rigid sphere in free solution and ignores screening by the surrounding counter-ions. Mobility increases with net charge and decreases with size.

Why DNA needs a gel to separate by size. Each nucleotide adds almost the same charge and mass, so the charge-to-mass ratio of DNA barely depends on its length. As a result, the free-solution mobility of DNA is nearly independent of size. Size separation comes from the sieving action of the gel, which slows longer molecules more.

Within a gel's linear range, the distance moved by linear double-stranded DNA is approximately linear in (length in bp). The length of an unknown band is therefore read from a ladder of known sizes run on the same gel.

Matrix choice by application

  1. Agarose gel electrophoresis (about 0.5–2% w/v) resolves linear double-stranded DNA from roughly 0.1 kb to about 25 kb. A higher % agarose resolves smaller fragments and a lower % resolves larger ones.

  2. Polyacrylamide gel electrophoresis (PAGE) resolves proteins (SDS-PAGE, native PAGE) and short nucleic acids. Denaturing (urea) PAGE can resolve single-stranded oligonucleotides that differ by one nucleotide.

  3. Isoelectric focusing (IEF) separates proteins by isoelectric point (pI) in a pH gradient, not by size.

  4. Pulsed-field gel electrophoresis (PFGE) separates very large DNA (hundreds of kb to Mb). A constant-field agarose gel cannot resolve these sizes.

Agarose % (w/v)

Approx. resolving range (linear dsDNA, constant field; varies with buffer and voltage)

0.5%

1–30 kb

1.0%

0.5–10 kb

1.5%

0.2–3 kb

2.0%

0.1–2 kb

EXAM TIP

Uncut plasmid DNA often gives more than one band. The same plasmid can run as a supercoiled (covalently closed circular), a linear and a nicked (open circular) form. In a typical agarose gel the supercoiled form usually runs fastest and the open circular form slowest, with linear in between. The order can change with agarose %, voltage and intercalating dye. Only the linear form should be sized against a linear DNA ladder.

SDS-PAGE and native PAGE

SDS (sodium dodecyl sulfate) is an anionic detergent. It binds proteins at a near-constant ratio of about 1.4 g SDS per g of protein, which coats each polypeptide with negative charge roughly proportional to its length.

Samples are also treated with heat and a reducing agent (dithiothreitol, DTT, or β-mercaptoethanol) that breaks disulfide bonds. The protein unfolds into an extended conformation. Charge-to-mass ratio and shape are now nearly equal for all proteins, so all move toward the anode and their migration in SDS-PAGE depends essentially on polypeptide chain length (molecular weight).

In native PAGE there is no SDS and no reducing agent. Each protein keeps its own charge and folded shape, so mobility depends on charge, size and shape together.

The discontinuous system. Most SDS-PAGE gels are discontinuous: a low-percentage stacking gel (pH about 6.8) sits on a higher-percentage resolving gel (pH about 8.8), and the running buffer is Tris–glycine.

  • In the stacking gel, glycine is mostly zwitterionic (net neutral) and moves slowly, while chloride moves fast. The proteins are compressed into a thin zone between the fast chloride and the slow glycine.
  • In the resolving gel, the higher pH makes glycine negatively charged. It overtakes the proteins, which then separate by size in the smaller pores.

SDS-PAGE MOLECULAR WEIGHT ESTIMATION

= (distance moved by the protein) ÷ (distance moved by the tracking-dye front). Plot (MW) of standard proteins against . The plot is approximately a straight line over the gel's resolving range, with because larger proteins have smaller . Read the unknown's MW from this line.

Under reducing conditions the result is the mass of each individual polypeptide chain (subunit), not of a native multi-subunit protein. Heavily glycosylated, unusually highly charged or incompletely denatured proteins can fall off the line.

WORKED EXAMPLE

On an SDS-PAGE gel the dye front moves 6.0 cm. A 100 kDa standard has and a 10 kDa standard has . An unknown polypeptide moves 3.0 cm. Assume (MW) is linear in over this range. Estimate the unknown's MW.

Solution
  1. Unknown: .

  2. Standards in Da: at , and at .

  3. Slope: per unit .

  4. .

  5. Da.

Answer: About 31.6 kDa (the mass of this polypeptide chain under reducing conditions).

Feature

SDS-PAGE (reducing)

Native PAGE

IEF

Denaturant

SDS + reducing agent + heat

None

No SDS. Native IEF: none. Denaturing IEF (e.g., first dimension of 2-D gels): urea, often thiourea, plus a zwitterionic or non-ionic detergent

Separates by

Size (polypeptide chain length)

Charge, size and shape together

Isoelectric point (pI)

Preserves activity / native structure

No

Yes

Native IEF: yes. Denaturing IEF: no

Typical use

Purity check, subunit MW estimate, input for Western blotting

In-gel activity staining, native complexes

pI determination, first dimension of 2-D gels

EXAM TIP

Deviations from the standard curve are expected in some cases. Glycoproteins bind less SDS per unit mass and usually run larger than their sequence-derived mass. A protein that keeps some structure because it was not fully denatured also runs anomalously.

Comparing a non-reducing gel (SDS, no DTT or β-mercaptoethanol) with a reducing gel shows whether subunits are joined by disulfide bonds. For example, an antibody of the IgG type gives one ~150 kDa band non-reduced, but ~50 kDa (heavy chain) and ~25 kDa (light chain) bands after reduction.

Isoelectric focusing and 2-D gels

Isoelectric focusing (IEF) separates proteins by isoelectric point (pI), the pH at which a protein's net charge is zero. A pH gradient is set up along the gel with carrier ampholytes or with an immobilised pH gradient (IPG) strip.

Below its pI a protein carries a net positive charge and moves toward the cathode. Above its pI it carries a net negative charge and moves toward the anode. The acidic (low-pH) end of the gradient is at the anode and the basic end is at the cathode. Each protein therefore moves toward the position where the local pH equals its pI, and stops there.

If a focused protein diffuses away from that position it regains a net charge and is driven back. This self-sharpening effect is why IEF bands are very narrow.

2-D gel electrophoresis workflow (in order)

  1. First dimension: IEF on an IPG strip separates proteins by pI. This is usually run under denaturing conditions (urea, often thiourea, and a zwitterionic detergent such as CHAPS), which leave a protein's charge unchanged.

  2. Equilibration: the strip is soaked in SDS + DTT to reduce disulfides, then in SDS + iodoacetamide to alkylate free thiols. This prevents re-oxidation and streaking.

  3. Second dimension: the strip is laid across the top of an SDS-PAGE slab gel and run perpendicular to the first dimension, separating by molecular weight.

  4. Staining (Coomassie, silver or a fluorescent dye) shows proteins as discrete spots, each placed by its (pI, MW).

  5. Spots of interest are cut out and identified, typically by mass spectrometry.

EXAM TIP

A 2-D gel separates by two independent properties, pI and MW. Two proteins that run together on a 1-D SDS-PAGE gel (same MW) can still be separated if their pI values differ. This is why 2-D gels are used for complex protein mixtures.

Microarrays and enzymatic assays

A DNA microarray carries thousands of known probe sequences (oligonucleotides or cDNAs) fixed at defined spots on a solid support. Labelled target nucleic acid is hybridised to the array; this is fluorescently tagged cDNA or cRNA made from an RNA sample. After unbound material is washed away, the signal at each spot reports the relative abundance of the matching transcript, so the expression of many genes is measured in one experiment.

In the two-colour format, cDNAs from two samples are labelled with different dyes (e.g., Cy3, green, and Cy5, red) and hybridised together to the same array. The red/green ratio at each spot gives the relative expression between the two samples.

Limits: an array detects only sequences represented by its probes, gives relative rather than absolute abundance, and can show background from cross-hybridisation of similar sequences.

Enzymatic assays measure enzyme activity from the initial (linear) rate of substrate use or product formation. This is taken before substrate depletion, product inhibition or enzyme instability curve the progress line. The measured rate is proportional to the amount of enzyme when it is an initial rate and the substrate is saturating (), so that the rate approaches for that amount of enzyme.

ENZYME UNIT AND KATAL

By convention, one unit (U) converts 1 µmol of substrate per minute under stated assay conditions. The SI unit is the katal, where 1 kat = 1 mol s⁻¹. Hence 1 U = kat ≈ 16.67 nkat.

SPECIFIC ACTIVITY

Units: U mg⁻¹. Specific activity measures enzyme purity. It rises through a purification as contaminating protein is removed, even though the total units recovered fall.

PURIFICATION TABLE

Both are calculated against the starting crude extract, not against the previous step.

WORKED EXAMPLE

A crude extract contains 2000 U of enzyme in 400 mg of protein. After ion-exchange chromatography the pooled fractions contain 1200 U in 20 mg of protein. Find the specific activity at each stage, the fold purification and the yield.

Solution
  1. Crude specific activity U/mg.

  2. After ion exchange: specific activity U/mg.

  3. Fold purification .

  4. Yield .

Answer: 5 U/mg and 60 U/mg; 12-fold purification; 60% yield.

BEER–LAMBERT LAW

is the absorbance (dimensionless). is the molar absorption (extinction) coefficient of the absorbing species in M⁻¹cm⁻¹, its concentration in M (mol L⁻¹), and the path length in cm (commonly 1 cm). The law holds for dilute solutions at low absorbance.

REACTION RATE FROM AN ABSORBANCE CHANGE

This gives the rate in M per unit time when only the monitored species changes absorbance. Multiply by the reaction volume (in L) to get mol per unit time. Then use the stoichiometry to convert to substrate converted, and compare with the unit definition.

EXAM TIP

Always check the unit definition a question gives; some define 1 U as 1 nmol min⁻¹. A common coupled-assay readout is NADH or NADPH, which absorbs at 340 nm (ε ≈ 6220 M⁻¹cm⁻¹), while NAD⁺ and NADP⁺ do not. The rate of cofactor oxidation or reduction is therefore followed as the change in .

Immunoassays: ELISA, RIA, immunohistochemistry and immunoblotting

Immunoassays use the specificity of antigen–antibody binding to detect and measure a target molecule.

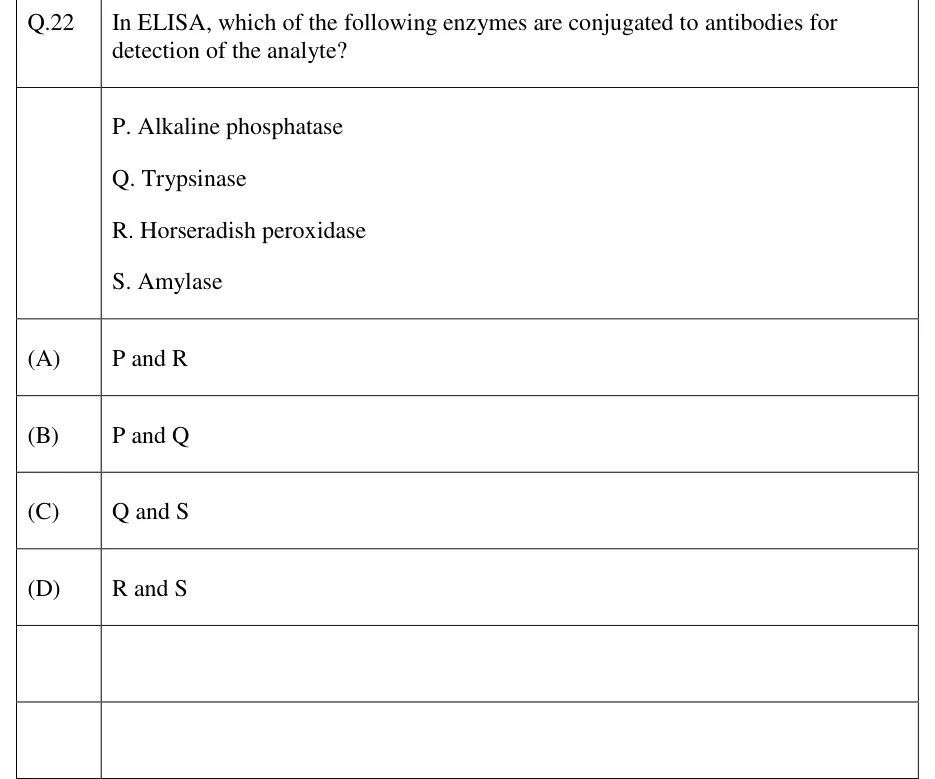
  • ELISA (enzyme-linked immunosorbent assay) uses an enzyme-conjugated antibody, typically carrying horseradish peroxidase (HRP) or alkaline phosphatase. The enzyme turns over its substrate to give a colorimetric, fluorescent or chemiluminescent signal.
  • RIA (radioimmunoassay) is classically competitive. A fixed amount of radiolabelled antigen competes with unlabelled antigen from the sample for a limited amount of antibody, so the bound radioactivity falls as sample antigen rises.
  • Immunohistochemistry (IHC) locates an antigen within a tissue section while keeping spatial information. It uses a fluorophore-labelled antibody or an enzyme-labelled antibody plus a chromogen; for example, HRP converts DAB to an insoluble brown precipitate.
  • Western blotting (immunoblotting) combines SDS-PAGE with antibody detection. Proteins are transferred from the gel to a membrane (nitrocellulose or PVDF), usually by electroblotting. The membrane is blocked to prevent nonspecific binding, probed with a primary antibody against the target, then with a labelled secondary antibody against the primary, and the signal is developed.

Blot types by what is transferred and how it is probed

  1. Southern blot: DNA, detected with a labelled nucleic acid probe.

  2. Northern blot: RNA, detected with a labelled nucleic acid probe.

  3. Western blot (immunoblot): protein separated by electrophoresis, detected with antibodies.

  4. Dot blot: sample spotted directly on the membrane with no electrophoretic separation. For proteins it is probed with antibodies, like a Western blot without the size information.

ELISA format

Principle

Signal vs. antigen concentration

Direct

An enzyme-labelled primary antibody binds antigen coated directly on the plate

Increases with antigen

Indirect

An unlabelled primary antibody binds antigen; an enzyme-labelled secondary antibody binds the primary, amplifying the signal

Increases with antigen; usually more sensitive than direct

Sandwich

A capture antibody on the plate binds the antigen; a labelled detection antibody binds a different epitope on the same antigen

Increases with antigen; needs an antigen with two non-overlapping epitopes, so it is unsuitable for small haptens

Competitive

Labelled antigen (or a fixed amount of antibody) competes with unlabelled sample antigen for limited binding sites

Decreases as sample antigen increases

Sandwich ELISA procedure (in order)

  1. Coat the microplate well with capture antibody specific to the target antigen. Incubate and wash.

  2. Block the remaining plastic surface with an inert protein (e.g., BSA or non-fat milk) to prevent nonspecific binding.

  3. Add the sample. Any target antigen present is captured. Wash away unbound material.

  4. Add an enzyme-conjugated detection antibody that binds a different epitope on the captured antigen. Wash away unbound conjugate.

  5. Add the enzyme substrate. Coloured or fluorescent product develops in proportion to the bound antigen. Stop the reaction and read absorbance or fluorescence.

EXAM TIP

In direct, indirect and sandwich ELISA, the signal rises with the amount of antigen in the sample. In competitive ELISA and classical RIA the relation is inverse: more sample antigen gives less signal.

Flow cytometry and FACS

In flow cytometry, cells in a single-cell suspension are hydrodynamically focused so that they pass one at a time through one or more focused laser beams.

  • Forward scatter (FSC), light scattered at small angles, correlates with cell size.
  • Side scatter (SSC), light scattered at about 90°, correlates with internal complexity or granularity.
  • Fluorescence comes from cells labelled with fluorophore-conjugated antibodies against surface or intracellular markers. It is collected through filters, one detector per colour, so many parameters are measured for each of thousands of cells per second.

When fluorophores' emission spectra overlap, compensation subtracts each dye's spill-over into the other detectors. Populations are then selected by gates drawn on the plots.

FACS (fluorescence-activated cell sorting) adds physical sorting: the same measurements decide, in real time, which cells are separated out.

FACS sorting procedure (in order)

  1. Stain the cell suspension with fluorophore-conjugated antibodies against the markers of interest.

  2. Hydrodynamically focus the cells into a single-file stream leaving a nozzle.

  3. Measure each cell by laser (FSC, SSC and fluorescence) in the intact stream, upstream of where it breaks into droplets. Compare the signals with preset gates.

  4. A vibrating (piezoelectric) nozzle breaks the jet into uniform droplets further downstream, ideally with at most one cell per droplet. The travel time from the laser to the break-off point is known.

  5. After that delay, just as the droplet containing a selected cell breaks off, the stream is given a positive or negative charge, so that droplet leaves charged.

  6. Charged droplets pass between deflection plates held at a fixed voltage. Positive and negative droplets are deflected into different collection tubes. Uncharged droplets go straight to waste.

EXAM TIP

On an FSC (x-axis) vs SSC (y-axis) plot of blood leukocytes, the main populations form separate clusters:

  • Small, agranular lymphocytes sit at low FSC and low SSC.
  • Monocytes are larger (higher FSC) with intermediate SSC.
  • Granulocytes such as neutrophils have high SSC and FSC above that of lymphocytes.

Whole-genome and ChIP sequencing

Whole-genome sequencing (WGS) reads an organism's genome as a whole. Genomic DNA is fragmented at random (shotgun) and made into a sequencing library. The library is sequenced to a chosen depth, and the reads are either aligned to a reference genome or assembled de novo.

WGS detects single-nucleotide variants and small indels across the genome. Short reads cannot place long repeats uniquely and miss some structural variants; long-read sequencing helps with repeats and structural variants.

MEAN SEQUENCING COVERAGE

is the number of reads, the read length in bp, the genome size in bp, and the mean coverage (depth, '×'). The estimate assumes reads land at random and uniformly (Poisson sampling). Real data are less uniform, so gaps are more common than this predicts.

WORKED EXAMPLE

A 5 Mb bacterial genome is sequenced with reads of 150 bp. Assume reads land at random and uniformly. Find the mean coverage and the expected fraction of the genome not covered by any read.

Solution
  1. Total bases sequenced bp.

  2. ×.

  3. Fraction not covered .

Answer: 3× mean coverage; about 5% of the genome is expected to have no read.

Chromatin immunoprecipitation followed by sequencing (ChIP-seq) maps where a specific protein binds DNA across the genome. The protein can be a transcription factor or a histone carrying a particular modification.

Cells are typically treated with formaldehyde to crosslink proteins to the DNA they contact. The chromatin is then sheared into short fragments, commonly by sonication. An antibody specific to the protein or histone mark pulls down only the DNA fragments bound to it.

For histone marks, native ChIP is also used. It skips crosslinking and fragments the chromatin with micrococcal nuclease.

ChIP-seq workflow (in order)

  1. Crosslink cells, typically with formaldehyde, to fix protein–DNA contacts in place.

  2. Lyse the cells and shear the chromatin into small fragments (sonication or enzymatic digestion).

  3. Immunoprecipitate with an antibody specific to the target protein or histone modification, pulling down only the bound DNA fragments.

  4. Reverse the crosslinks (heat), digest protein (proteinase K) and RNA (RNase), and purify the enriched DNA.

  5. Build a sequencing library from the enriched DNA and sequence it, together with a control library from input (non-immunoprecipitated) chromatin.

  6. Align the reads to the reference genome and call peaks, the regions where reads are significantly enriched over the control. These mark the binding sites.

EXAM TIP

A ChIP-seq experiment should sequence a matched control alongside the immunoprecipitate. This is usually input chromatin, and sometimes a mock IP with non-specific IgG. Without it, regions that are easily sheared or over-represented (such as open chromatin) can be mistaken for true binding peaks.

PREVIOUS-YEAR QUESTIONS

9 questions from the BT papers

Try each question first, then open the answer. We placed each question under a topic ourselves; the exam paper does not label topics.

See these papers in full: GATE BT 2026 · GATE BT 2025 · GATE BT 2023 · GATE BT 2020 · GATE BT 2019

GATE 2026 BT Q.14

GATE 2026 · BTQ.14 · 1 mark · MCQ

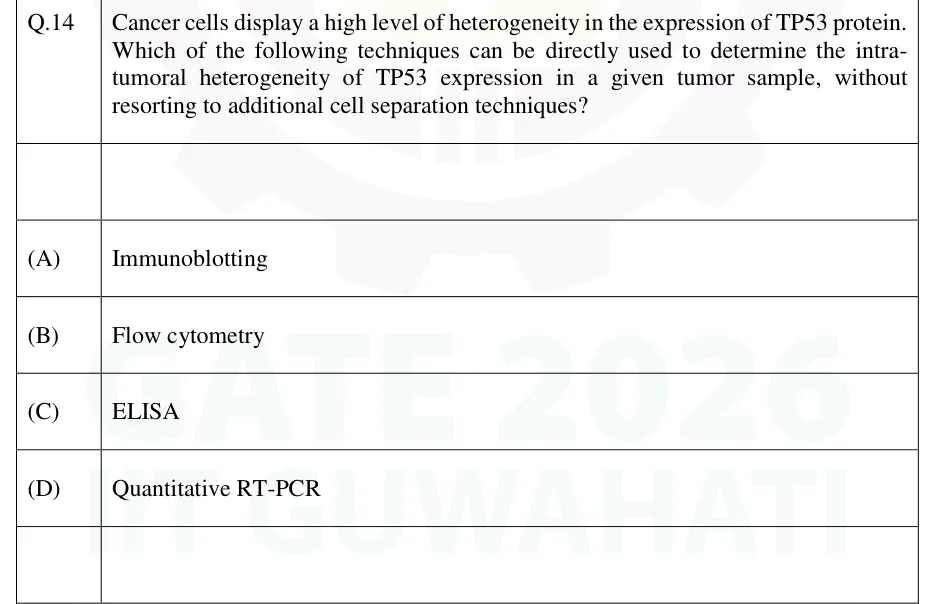
Cancer cells display a high level of heterogeneity in the expression of TP53 protein. Which of the following techniques can be directly used to determine the intra-tumoral heterogeneity of TP53 expression in a given tumor sample, without resorting to additional cell separation techniques?

  1. (A)

    Immunoblotting

  2. (B)

    Flow cytometry

  3. (C)

    ELISA

  4. (D)

    Quantitative RT-PCR

Answer and solution
See the question in the paper
GATE 2026 BT Q.14: answer and solution

GATE 2020 BT Q.52

GATE 2020 · BTQ.52 · 2 marks · NAT

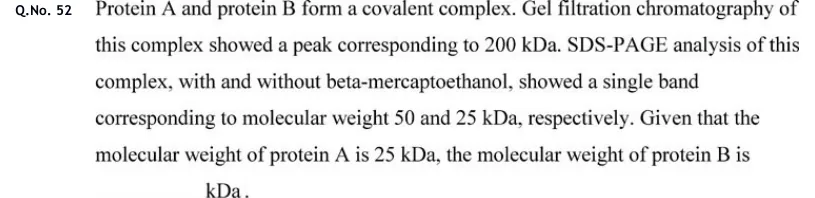
Protein A and protein B form a covalent complex. Gel filtration chromatography of this complex showed a peak corresponding to 200 kDa. SDS-PAGE analysis of this complex, with and without beta-mercaptoethanol, showed a single band corresponding to molecular weight 50 and 25 kDa, respectively. Given that the molecular weight of protein A is 25 kDa, the molecular weight of protein B is ___ kDa.

Answer and solution
See the question in the paper
GATE 2020 BT Q.52: answer and solution

GATE 2019 BT Q.33

GATE 2019 · BTQ.33 · 2 marks · MCQ

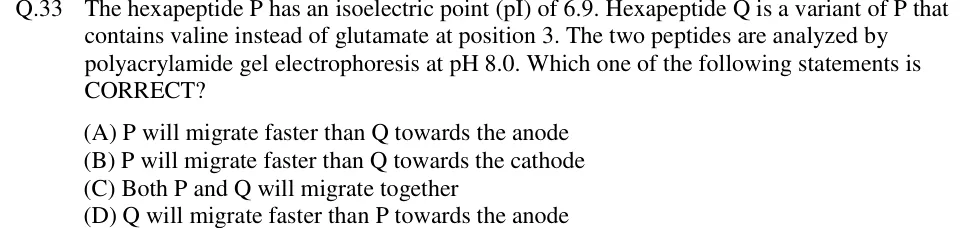
The hexapeptide P has an isoelectric point (pI) of 6.9. Hexapeptide Q is a variant of P that contains valine instead of glutamate at position 3. The two peptides are analyzed by polyacrylamide gel electrophoresis at pH 8.0. Which one of the following statements is CORRECT?

  1. (A)

    P will migrate faster than Q towards the anode

  2. (B)

    P will migrate faster than Q towards the cathode

  3. (C)

    Both P and Q will migrate together

  4. (D)

    Q will migrate faster than P towards the anode

Answer and solution
See the question in the paper
GATE 2019 BT Q.33: answer and solution

PRACTICE

6 questions to test yourself

PRACTICE 11 mark · MCQ

In SDS-PAGE, after treatment with SDS, heat and a reducing agent, the migration distance of a protein through the gel is primarily determined by its:

  1. (A)

    Net charge on the native protein

  2. (B)

    Molecular size (chain length)

  3. (C)

    Isoelectric point

  4. (D)

    Tertiary/quaternary structure

Answer and solution

Answer: (B)

  1. SDS binds proteins at a roughly constant ratio (~1.4 g SDS per g protein). This coats them with negative charge roughly proportional to chain length and masks the protein's own charge.

  2. The reducing agent (DTT or β-mercaptoethanol) breaks disulfide bonds, and together with heat and SDS it unfolds the protein into an extended chain.

  3. Charge-to-mass ratio and shape are now nearly equal for all proteins, so migration through the sieving gel depends essentially on polypeptide size (chain length). The answer is B.

PRACTICE 22 marks · NAT

An enzyme assay is run in a 3.0 mL reaction in a 1 cm cuvette. It is followed by the absorbance of the product, which is the only species absorbing at the chosen wavelength (molar extinction coefficient 6000 M⁻¹cm⁻¹). One molecule of product forms per molecule of substrate converted. Absorbance rises linearly by 0.150 over the first 2 minutes. One unit (U) of enzyme converts 1 µmol of substrate per minute under these conditions. Calculate the total enzyme activity in the 3.0 mL reaction, in U.

Answer and solution

Answer: (accepted range )

  1. Rate of absorbance change: min⁻¹.

  2. Concentration rate: M min⁻¹ µM min⁻¹.

  3. Amount per minute in 3.0 mL ( L): mol min⁻¹ µmol min⁻¹ of product, which equals the substrate converted (1:1).

  4. Since 1 U = 1 µmol min⁻¹, the total activity is 0.0375 U.

PRACTICE 31 mark · MCQ

In native PAGE (no SDS, no reducing agent), the electrophoretic separation of proteins depends on:

  1. (A)

    Molecular size alone

  2. (B)

    Net charge alone

  3. (C)

    A combination of size, shape and native charge

  4. (D)

    Isoelectric point alone

Answer and solution

Answer: (C)

  1. Without SDS, each protein keeps its own net charge, which depends on its amino acid composition and the buffer pH.

  2. Without denaturation, the native shape (globular, elongated, oligomeric) affects the protein's frictional drag through the gel.

  3. Mobility therefore depends on charge, size and shape together, unlike SDS-PAGE, where charge and shape are made nearly equal so that size dominates. The answer is C.

PRACTICE 42 marks · MSQ

Which of the following statements about isoelectric focusing (IEF) are correct?

  1. (A)

    A protein stops migrating at the pH equal to its pI, where its net charge is zero

  2. (B)

    IEF separates proteins primarily based on molecular weight

  3. (C)

    The pH gradient is established using carrier ampholytes or immobilized pH gradient (IPG) strips

  4. (D)

    The focusing effect is self-sharpening because diffusion away from the pI zone restores net charge and drives the protein back

Answer and solution

Answer: (A), (C), (D)

  1. A protein's net charge is zero at its pI. In a pH gradient it stops migrating where the local pH equals its pI. A is correct.

  2. IEF separates by pI, not by molecular weight; separation by MW is done afterwards by the SDS-PAGE second dimension of a 2-D gel. B is false.

  3. The pH gradient is formed either by carrier ampholytes, which move to their own pI under the field, or by an IPG strip cast with a fixed gradient of immobilised buffering groups. C is correct.

  4. A protein that diffuses away from its pI gains a net charge, positive on the acidic side and negative on the basic side, and is driven back. Bands therefore sharpen instead of spreading. D is correct.

PRACTICE 51 mark · MCQ

In a flow cytometry dot plot with forward scatter (FSC) on the x-axis and side scatter (SSC) on the y-axis, where would neutrophils be expected to appear relative to lymphocytes in the same blood sample?

  1. (A)

    Same region as lymphocytes — low FSC, low SSC

  2. (B)

    A distinct region — high FSC and high SSC

  3. (C)

    High SSC only, at the same FSC as lymphocytes

  4. (D)

    High FSC only, at the same SSC as lymphocytes

Answer and solution

Answer: (B)

  1. FSC correlates with cell size. Neutrophils are larger than small lymphocytes, so their FSC is higher.

  2. SSC correlates with internal granularity. Neutrophils have many cytoplasmic granules and lymphocytes are agranular, so neutrophil SSC is higher.

  3. Neutrophils therefore form a separate cluster at higher FSC and higher SSC than the lymphocyte cluster (low FSC, low SSC). The answer is B.

PRACTICE 61 mark · MCQ

In a competitive ELISA, labelled antigen competes with antigen in the sample for a fixed, limited number of antibody binding sites on the plate. As the concentration of antigen in the sample increases, the measured signal:

  1. (A)

    Increases in proportion to the antigen concentration

  2. (B)

    Decreases

  3. (C)

    Stays constant, because the number of antibody sites is fixed

  4. (D)

    First increases, then decreases

Answer and solution

Answer: (B)

  1. The antibody sites are limited, so labelled and unlabelled antigen share them in proportion to their amounts.

  2. More unlabelled sample antigen takes more of the sites, leaving fewer for the labelled antigen.

  3. Only the bound labelled antigen gives a signal, so the signal decreases as sample antigen increases. The answer is B.

OFFICIAL GATE 2027 SYLLABUS WORDING

Copied from the GATE 2027 syllabus; see all 2027 syllabi.

GATE BT

Electrophoresis; Micro- arrays; Enzymatic assays; Immunoassays - ELISA, RIA, immunohistochemistry; Immunoblotting; Flow cytometry; Whole genome and ChIP sequencing

Preparing in Kolkata? IAE Academy's course for GATE BT.