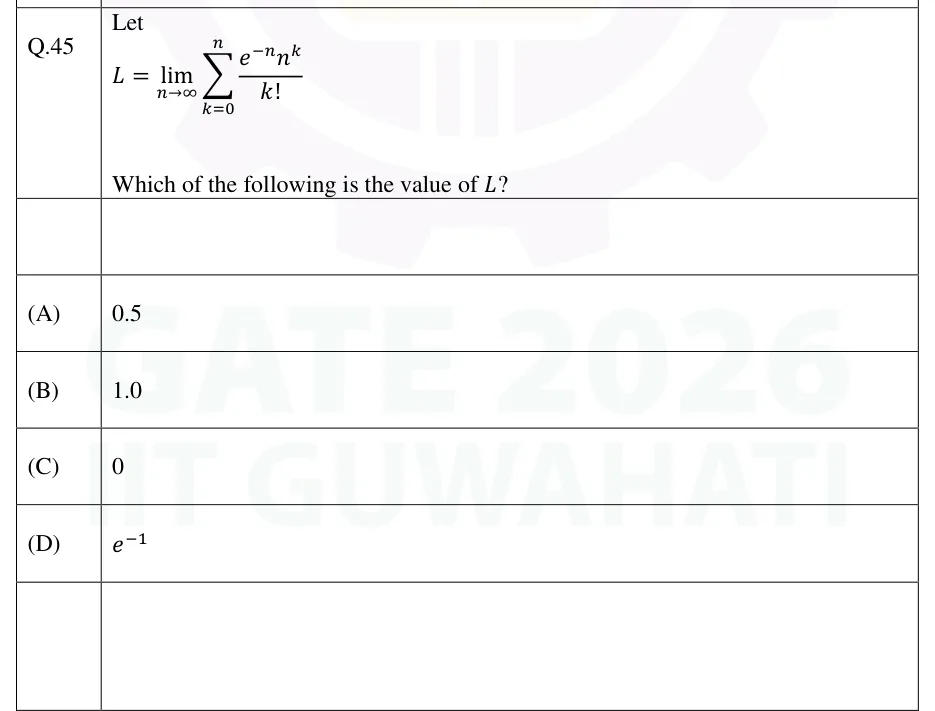
GATE 2026 DA Q.45
Let Which of the following is the value of ?
- (A)
0.5
- (B)
1.0
- (C)
0
- (D)

GATE DA
Central limit theorem, confidence intervals and hypothesis tests
The sample mean of independent observations has mean and standard deviation , and by the central limit theorem it is approximately normal for large . That one fact drives confidence intervals, z and t tests, and (with the chi-squared distribution) tests on counts and variances. GATE questions ask you to pick the right statistic and distribution, compute a statistic, interval width or p-value, and interpret the result correctly.
2 previous-year questions · 2 solved · 6 practice questions
A statistic such as the sample mean is itself random: different samples give different values. Its distribution is the sampling distribution. Take independent and identically distributed (i.i.d.) with mean and variance (here is the population variance, , and ).
MEAN AND STANDARD ERROR OF THE SAMPLE MEAN
Needs independent observations with a common mean and finite variance ; no normality is needed. SE (standard error) is the standard deviation of . When is unknown it is estimated by , where is the sample standard deviation (divisor , below).
SAMPLE VARIANCE (DIVIDES BY N − 1)
Dividing by makes an unbiased estimator of . Dividing by instead gives an estimator whose expectation is . Throughout these notes is the version.
CENTRAL LIMIT THEOREM
For i.i.d. observations with finite mean and variance, is approximately for large , whatever the shape of the population. Equivalently, the sum is approximately . If the population is itself normal, is exactly normal for every .
NORMAL APPROXIMATION TO THE BINOMIAL WITH CONTINUITY CORRECTION
For , which has mean and variance . A common rule of thumb is and (some use 10). is the standard normal CDF. The moves each integer boundary to the middle of the gap between integers.
EXAM TIP
The standard error shrinks like : to halve it you need four times the sample size. Do not confuse (spread of single observations) with (spread of the mean).
Notation (upper-tail critical values). is the value with for , so . Likewise and cut off an upper-tail area of the t and chi-squared distributions with degrees of freedom. This convention is used throughout.
A confidence interval is built by a procedure that, over repeated samples, covers the true parameter in a fraction of samples. For one computed interval the parameter either lies inside or it does not; the statement 'the probability that lies in this interval is 0.95' is not the correct reading.
CONFIDENCE INTERVAL FOR A MEAN, SIGMA KNOWN (Z)
Independent observations; population normal, or large (CLT). Commonly used values: (90%), (95%), (99%).
CONFIDENCE INTERVAL FOR A MEAN, SIGMA UNKNOWN (T)
Population normal (for large the interval is approximately valid without normality, and ). Here is the sample variance with divisor . The t distribution has degrees of freedom and heavier tails than the normal, so ; it approaches as grows.
CONFIDENCE INTERVAL FOR A PROPORTION
Large-sample (normal) interval, valid when and are both large. is the sample proportion.
WIDTH AND SAMPLE SIZE FOR A MEAN (SIGMA KNOWN)
is the required margin of error (half-width). Round up to the next integer.
Width grows with and with the confidence level (larger ).
Width shrinks as .
With the same standard error , using in place of gives a wider interval, because .
The centre of these intervals is (or ); each is symmetric about its centre.
A test compares a null hypothesis (the default claim, always containing equality, for example ) with an alternative . A one-sided alternative ( or ) puts all of the rejection region in one tail; a two-sided alternative () splits equally between both tails.
State and (decide one- or two-sided from the question).
Fix the significance level .
Compute the test statistic from the data, assuming is true.
Find the critical value(s), or the p-value: the probability, under , of a statistic at least as extreme as the one observed (in the direction of ).
Reject if the statistic is in the rejection region, equivalently if p-value . Otherwise fail to reject .
Decision | true | false |
|---|---|---|
Reject | Type I error, probability | Correct (probability = power) |
Fail to reject | Correct | Type II error, probability |
ERROR PROBABILITIES AND POWER
depends on which alternative value is true. For a composite (such as ), is the largest Type I error probability over . For a fixed sample size and a fixed alternative, reducing increases . Increasing can reduce both.
P-VALUE FOR A TWO-SIDED Z-TEST
For a one-sided test use when (upper tail) and when (lower tail).
EXAM TIP
'Fail to reject ' is not 'prove '. The p-value is not the probability that is true. A two-sided test at level rejects exactly when lies outside the matching confidence interval (z-test with the z-interval, t-test with the t-interval, same standard error).
ONE-SAMPLE Z-TEST STATISTIC
Use when is known and the population is normal or is large. Under , (exactly for normal data, approximately otherwise).
ONE-SAMPLE T-TEST STATISTIC
Use when is unknown and the population is normal; uses divisor . Under , follows a t distribution with degrees of freedom.
THE T DISTRIBUTION WITH NU DEGREES OF FREEDOM
Symmetric about 0 with heavier tails than ; it tends to as . For normal data, has this distribution with .
TWO-SAMPLE POOLED T-TEST (EQUAL VARIANCES)
Independent samples from normal populations assumed to share the same variance; tests . is the pooled sample variance.
PAIRED T-TEST
For matched pairs (for example before/after on the same subjects), take differences . and are their mean and sample SD (divisor ). The differences are assumed normal; tests . Do not use the two-sample formula on paired data.
TWO-SAMPLE Z-TEST STATISTIC
Independent samples, variances known, populations normal or both samples large; tests .
ONE-SAMPLE TEST FOR A PROPORTION
Large . Note that the standard error uses (the value under ), whereas the confidence interval uses .
TWO-SAMPLE TEST FOR PROPORTIONS
Independent large samples; tests . Under the common proportion is estimated by the pooled .
Situation | Statistic | Reference distribution |
|---|---|---|
One mean, known, normal data or large | ||
One mean, unknown, normal data | t with df | |
Two means, known | two-sample | |
Two means, equal unknown variances, normal data | pooled | t with df |
Paired observations | paired on differences | t with df |
One proportion, large | ||
Two proportions, large samples | pooled | |
One variance, normal data | with df |
WORKED EXAMPLE
A machine fills packets with standard deviation g (known). A sample of packets has mean g. Test against at . Use and .
Standard error: .
Statistic: .
Two-sided critical value is ; .
p-value , which exceeds .
Answer: , p-value : fail to reject at the 5% level.
THE CHI-SQUARED DISTRIBUTION WITH K DEGREES OF FREEDOM
Takes only non-negative values and is right-skewed. The sum of independent chi-squared variables is chi-squared, with the degrees of freedom added.
CHI-SQUARED STATISTIC (GOODNESS OF FIT AND INDEPENDENCE)
= observed count, = expected count under , = total count. Large values mean poor agreement, so these two tests are upper-tailed: reject when exceeds . The chi-squared approximation needs expected counts that are not tiny (a common rule is ).
DEGREES OF FREEDOM, GOODNESS OF FIT
categories, parameters estimated from the data. If fully specifies the probabilities, and .
TEST OF INDEPENDENCE IN AN R BY C TABLE
= row total, = column total, = grand total. : the two classifications are independent.
CHI-SQUARED TEST FOR A SINGLE VARIANCE
Tests for a normal population ( with divisor ); the result is sensitive to non-normality. Unlike the count tests above, this test can be two-sided: for reject if or . For reject if .
CONFIDENCE INTERVAL FOR A VARIANCE (NORMAL POPULATION)
With the upper-tail convention, is the larger critical value, so it gives the lower limit. The interval is not symmetric about .
Goodness of fit: says the data follow a stated distribution (for example, a fair die).
Independence: says row and column variables are unrelated.
Compute every , then , then compare with the upper-tail critical value for the right df.
Counts, not percentages, must be used in the formula.
WORKED EXAMPLE
In a table of 100 people the observed counts are . Using the uncorrected statistic (no continuity correction), test independence at given .
Every row and column total is , , so each .
Each cell contributes or ; four cells give .
; .
Answer: with 1 df: reject independence at the 5% level.
EXAM TIP
Check degrees of freedom first: a goodness-of-fit test with 6 categories and no estimated parameters has df , not 6. Each estimated parameter removes one more degree of freedom. For tables some questions apply Yates' continuity correction, . In the example above that gives , which reverses the decision, so use the statistic the question specifies.
PREVIOUS-YEAR QUESTIONS
Try each question first, then open the answer. We placed each question under a topic ourselves; the exam paper does not label topics.
See these papers in full: GATE DA 2026 · GATE DA 2025
Let Which of the following is the value of ?
0.5
1.0
0
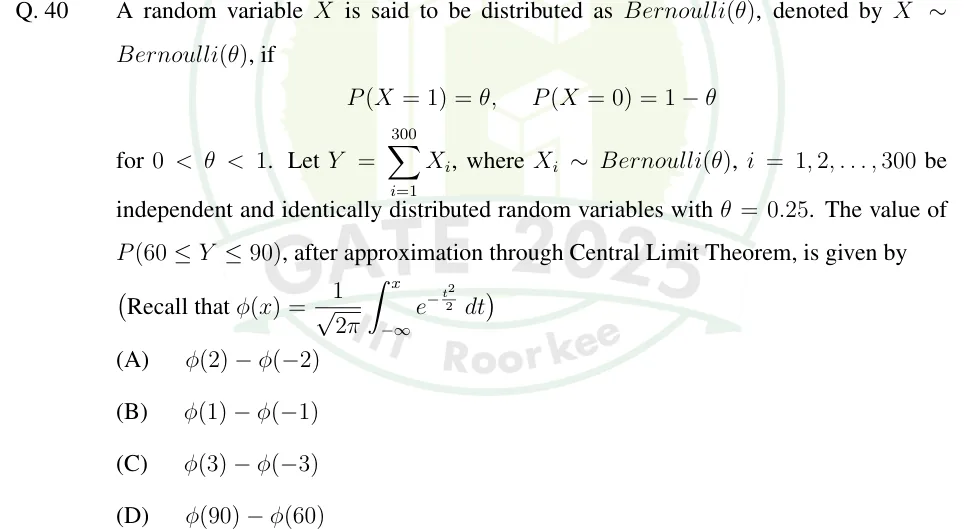
A random variable is said to be distributed as Bernoulli(), denoted by Bernoulli(), if , for . Let , where Bernoulli(), be independent and identically distributed random variables with . The value of , after approximation through Central Limit Theorem, is given by (Recall that )
PRACTICE
A population has standard deviation . A random sample of is drawn, and is large enough for the central limit theorem to apply. Using , the probability that the sample mean exceeds the population mean by more than is approximately
0.0668
0.1587
0.0228
0.9332
Answer: (A)
Standard error: .
.
.
A die is rolled 60 times, giving the face counts for faces 1 to 6. To test whether the die is fair, compute the chi-squared goodness-of-fit statistic .
Answer: (accepted range )
Under (fair die) each face has expected count .
Squared deviations: , , , , , ; sum .
(df ).
Which of the following statements are correct?
For a fixed confidence level and fixed , increasing the sample size makes the z-confidence interval for a mean narrower.
For the same data, a 99% confidence interval for a mean is wider than the 95% interval.
The significance level of a test is the probability of a Type II error.
If the 95% z-confidence interval for ( known) computed from a sample is , then the two-sided z-test of at on the same sample does not reject .
Answer: (A), (B), (D)
A: width decreases as increases. True.
B: , so the interval is wider. True.
C: is the Type I error probability; Type II is . False.
D: lies inside , so by the duality between the z-interval and the z-test, is not rejected at the 5% level. True.
. Using the normal approximation with continuity correction and , find . Give the answer to four decimal places.
Answer: (accepted range )
Mean ; standard deviation .
With continuity correction for .
.
.
A random sample of observations from a normal population with unknown variance has and sample standard deviation (dividing by ). We test against at the 5% level. Given , which is correct?
with 15 df; reject
with 15 df; fail to reject
with 15 df; fail to reject
with 16 df; reject
Answer: (B)
is unknown and the population is normal, so use the t-test with .
.
Two-sided critical value is ; , so is not rejected.
The population standard deviation of a measurement is known to be . What is the smallest sample size for which the 95% z-confidence interval for the mean has a margin of error (half-width) of at most ? Use .
Answer:
Require , i.e. .
.
must be an integer, so round up: .
OFFICIAL GATE 2027 SYLLABUS WORDING
Copied from the GATE 2027 syllabus; see all 2027 syllabi.
GATE DA
Central limit theorem, confidence interval, z-test, t-test, chi-squared test
Preparing in Kolkata? IAE Academy's course for GATE DA.