GATE 2026 DA Q.62
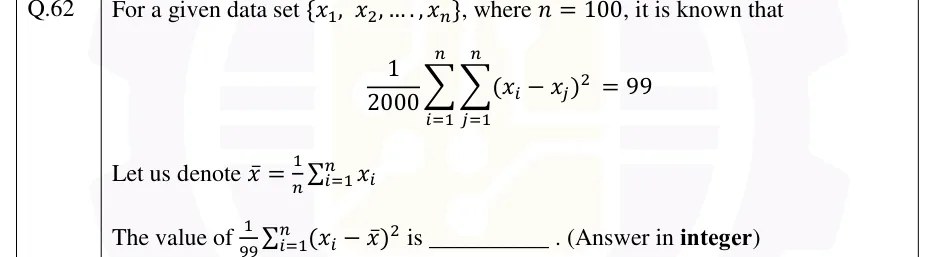
For a given data set , where , it is known that
Let us denote . The value of is ______. (Answer in integer)

GATE DA
Mean, median, mode, standard deviation, covariance and correlation
This topic covers the summary measures of a data set (centre and spread) and of a pair of variables (covariance and correlation). GATE DA questions test the exact formulas, the effect of shifting and scaling, the n versus n - 1 convention, combining two groups, and the difference between zero correlation and independence.
4 previous-year questions · 4 solved · 5 practice questions
The mean is the balance point of the data, the median is the middle value after sorting, and the mode is the most frequent value. For raw data with values the mean is the sum divided by . The mean uses every value, so one extreme value moves it; the median depends only on the order, so it resists extreme values.
ARITHMETIC MEAN
Raw data. For grouped data with frequencies and class midpoints , use . This treats every value as sitting at its class midpoint, so it is an approximation unless the values really are the midpoints.
MEDIAN OF RAW DATA
Here is the -th smallest value; sort first.
MEDIAN OF GROUPED DATA
The median class is the first class whose cumulative frequency is at least . = its lower class boundary, , = cumulative frequency of the classes before it, = its frequency, = its width. Classes must be continuous: if the class limits leave gaps (10-19, 20-29), use the boundaries (9.5-19.5, 19.5-29.5).
MODE OF GROUPED DATA
= lower boundary of the modal class (highest frequency ), and = frequencies of the classes just before and after it, = class width. The modal class and its two neighbours must have the same width. If the modal class is the first or last class, take the missing neighbour's frequency as .
MEAN, MEDIAN AND MODE OF A RANDOM VARIABLE
is the pmf, the pdf and the CDF. The median condition is for a continuous (in general a median satisfies and ). The mean exists only when the sum or integral of converges. Example: for the exponential distribution with rate , gives median , while the mean is and the mode is .
DEVIATIONS FROM THE MEAN
For any constant , the sum of squared deviations is therefore smallest when . The sum of absolute deviations is smallest when is the median (for even , any between the two middle values).
EMPIRICAL RELATION (APPROXIMATE)
Holds only approximately, for a moderately skewed, unimodal distribution. Use it only when a question says so.
Measure | Uses all values | Affected by an extreme value | May be non-unique |
|---|---|---|---|
Mean | Yes | Strongly | No |
Median | No (order only) | Not by how extreme it is (only the order matters) | No (with the averaging convention above) |
Mode | No (counts only) | No | Yes (bimodal, multimodal, or none) |
The range is the largest value minus the smallest. The quartiles split sorted data into four parts, and the interquartile range is . There are several conventions for computing quartiles, so a question will state one. A common one: is the median, is the median of the lower half and is the median of the upper half (leaving out the median itself when is odd).
The variance measures the average squared distance from the mean, and the standard deviation (SD) is its square root. There are two versions. The population variance divides by . Use it when the data are the whole population, or for the variance of a random variable. The sample variance divides by . Use it when the data are a sample used to estimate the variance of a larger population. Always read which one is asked. If a question does not say, state the convention you use and check whether the options include one version.
POPULATION VARIANCE AND SD (DIVIDE BY N)
is the population mean. The second form is the shortcut .
SAMPLE VARIANCE AND SD (DIVIDE BY N - 1)
is an unbiased estimator of the population variance. For the same data it relates to the divide-by- value by .
VARIANCE OF A RANDOM VARIABLE
. If picks one of the data values uniformly at random, this equals the population (divide-by-) variance of the data.
COEFFICIENT OF VARIATION
Defined for data with a positive mean. It has no units, so it compares the spread of data sets measured on different scales: the one with the larger CV is relatively more variable.
EXAM TIP
A variance is never negative, and it is zero only when all the values are equal. If the shortcut gives a negative number, you have made an arithmetic slip.
Suppose every value is transformed as . Adding slides the whole data set, so the centre measures move by and the spread measures do not change. Multiplying by stretches the data, so the centre measures are multiplied by and the spread measures by (the variance by ).
EFFECT OF $Y=AX+B$ ON CENTRE AND SPREAD
This holds for the population and the sample versions alike. The median and the mode also transform as .
Quantity | After |
|---|---|
Mean, median, mode | |
Variance | |
SD, range, IQR | |
Covariance with a third variable | |
Coefficient of variation | Unchanged if and ; changes in general when |
EXAM TIP
The shift never affects a spread measure, and neither does the sign of . A common slip is to multiply a variance by (or ) instead of .
Let group 1 have values with mean and variance , and group 2 have values with mean and variance , each variance divided by its own group size. The combined group has values. The combined mean is the weighted average of the group means. The combined variance is the weighted average of the group variances plus the weighted average of the squared distances of the group means from the combined mean. Because of that second part, the combined variance is at least the size-weighted average of the group variances. The two are equal only when the group means are equal.
COMBINED MEAN
Weighted by group size. It equals the plain average only when .
COMBINED VARIANCE (POPULATION FORM, DIVIDE BY N)
Both group variances must be the divide-by- kind. If sample variances are given, first convert them with .
Covariance measures how two variables move together. It is positive when large values of one go with large values of the other, and negative when large values go with small ones. Its size depends on the units, so on its own it is hard to interpret. Correlation divides the covariance by the two standard deviations. The result has no units, lies between and , and measures the strength of the linear relationship.
COVARIANCE (RANDOM VARIABLES)
, and for a constant .
SAMPLE COVARIANCE OF PAIRED DATA
For the population version, divide by instead. State the convention you use.
PEARSON CORRELATION COEFFICIENT
Both variances must be positive and finite. The or factors cancel in , so the sample value does not depend on the convention.
LINEAR TRANSFORMATION RULES
For and . A positive-slope linear change of either variable leaves the correlation unchanged; a negative multiplier on exactly one variable flips its sign.
COVARIANCE IS BILINEAR
Covariance is linear in each argument separately. Note the in : variances never subtract.
VARIANCE OF A SUM
The cross term vanishes when the covariance is zero (for example, when and are independent).
VARIANCE OF A SUM OF N VARIABLES
If the are pairwise uncorrelated, the variance of the sum is the sum of the variances.
VARIANCE OF THE MEAN OF N INDEPENDENT VALUES
For independent (pairwise uncorrelated is enough) with common variance ; here .
CORRELATION AND THE REGRESSION SLOPES
is the least-squares slope of the line of on , and that of on . Both lines pass through . The two slopes and share one sign, so is the square root of taken with that sign. Use the same divisor in the covariance and the variances.
SPEARMAN RANK CORRELATION
is the difference between the ranks of and . This shortcut is exact only when there are no tied ranks. With ties, compute Pearson's on the ranks instead.
always (by the Cauchy-Schwarz inequality).
exactly when with , and exactly when with (with probability 1).
means no linear relationship, and near means a weak linear trend. Neither means no relationship.
Swapping the roles of and does not change or .
If and are independent (and have finite variances), then , so and . The converse is false. Zero correlation only rules out a linear relationship; can still be an exact function of . The standard counterexample: uniform on and . Then and , so , yet knowing fixes , so they are dependent.
Statement | True? |
|---|---|
Independent uncorrelated | Yes (finite variances) |
Uncorrelated independent | No, in general |
dependent | Yes (exact linear relation) |
Jointly normal and uncorrelated independent | Yes, a special property of the joint normal |
Each of and normal (not jointly) and uncorrelated independent | No |
WORKED EXAMPLE
Group A has 20 values with mean 40 and SD 6. Group B has 30 values with mean 50 and SD 4 (both SDs computed by dividing by the group size). Find the mean and SD of the 50 combined values.
Combined mean: .
Deviations of the group means from : , .
Group A: . Group B: .
Combined variance: .
SD .
Answer: Mean , variance , SD .
WORKED EXAMPLE
Paired data : . Find the sample covariance (divide by ) and the correlation coefficient.
, .
Deviations of : . Deviations of : .
, so .
and .
.
Answer: Sample covariance (population version ), and under either convention.
EXAM TIP
When a question gives the SDs of two groups, check whether they are the divide-by- or the divide-by- kind before using the combined-variance formula. Remember that a correlation of does not mean independence, and that does not change when you rescale either variable by a positive constant.
PREVIOUS-YEAR QUESTIONS
Try each question first, then open the answer. We placed each question under a topic ourselves; the exam paper does not label topics.
See these papers in full: GATE DA 2026 · GATE DA 2024
For a given data set , where , it is known that
Let us denote . The value of is ______. (Answer in integer)
Let be a random variable that follows distribution. The conditional distribution of the random variable given is the distribution.
The value of is ______. (Answer in integer)
The sample average of 50 data points is 40. The updated sample average after including a new data point taking the value of 142 is ______.
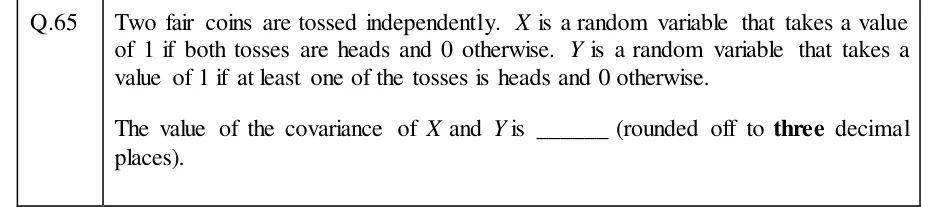
Two fair coins are tossed independently. is a random variable that takes a value of 1 if both tosses are heads and 0 otherwise. is a random variable that takes a value of 1 if at least one of the tosses is heads and 0 otherwise.
The value of the covariance of and is ______ (rounded off to three decimal places).
PRACTICE
A data set of 10 numbers has mean 12 and standard deviation 3. Every value is replaced by . Find the variance of the new data set (using the same divisor convention as for the original SD).
Answer:
Variance scales by with ; the shift has no effect on spread.
Original variance .
New variance .
Group 1 has 10 values with mean 20 and variance 9. Group 2 has 40 values with mean 30 and variance 16 (both variances divided by the group size). Find the variance of the 50 combined values.
Answer: (accepted range )
Combined mean .
, .
Group 1 term: . Group 2 term: .
.
The five observations 2, 3, 5, 6, 9 are a sample from a larger population. The unbiased (divide by ) estimate of the population variance is
6
7.5
30
5.5
Answer: (B)
Mean .
Squared deviations: , sum .
Divide by : .
(6 is the divide-by- value and 30 is the sum of squared deviations.)
Let be uniform on (each with probability ) and let . Which of the following statements are TRUE?
and are independent
The correlation coefficient of and is
The correlation coefficient of and is
Answer: (A), (C)
and , so . A is true.
is determined by : for example , so they are dependent. B is false.
and , so is defined and equals . C is true.
D is false since .
For the paired data : , compute the Pearson correlation coefficient . Give the answer correct to three decimal places.
Answer: (accepted range )
, .
Deviations of : . Deviations of : .
; ; .
.
OFFICIAL GATE 2027 SYLLABUS WORDING
Copied from the GATE 2027 syllabus; see all 2027 syllabi.
GATE DA
mean, median, mode and standard deviation, correlation, and covariance
Preparing in Kolkata? IAE Academy's course for GATE DA.