
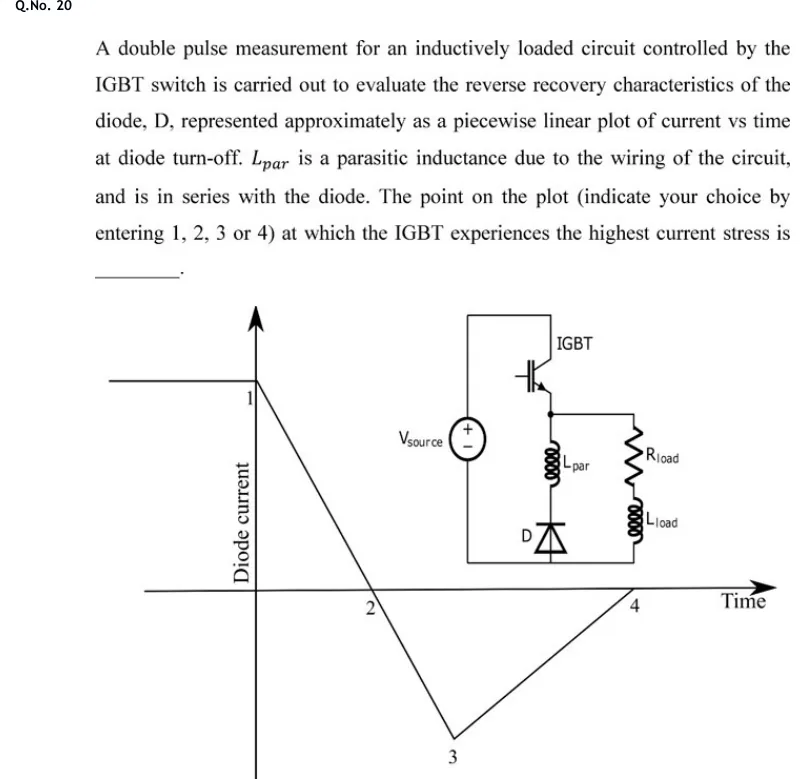
A double pulse measurement for an inductively loaded circuit controlled by the IGBT switch is carried out to evaluate the reverse recovery characteristics of the diode, D, represented approximately as a piecewise linear plot of current vs time at diode turn-off. is a parasitic inductance due to the wiring of the circuit, and is in series with the diode. The point on the plot (indicate your choice by entering 1, 2, 3 or 4) at which the IGBT experiences the highest current stress is ______.
 Tap to open full size
Figure description
Left: plot of diode current (vertical axis) versus time (horizontal axis). The current is a constant positive level up to time zero (point 1, at the top, where the fall begins). It then falls linearly with a steep slope, crossing zero at point 2, and continues to a negative peak at point 3 (the maximum reverse recovery current). From point 3 it rises linearly back to zero at point 4 on the time axis. Right: circuit with a voltage source V_source (plus at top) feeding an IGBT in series at the top. The IGBT emitter node connects to two parallel branches: the diode branch (L_par in series with diode D, D pointing upward so its anode is at the bottom and its cathode at the top, toward the L_par and IGBT node) and the load branch (R_load in series with L_load). Both branches return to the negative terminal of the source.