Time, phase and frequency measurement, oscilloscopes and spectrum analysers
Time, frequency and phase are measured by counting. A universal counter-timer either counts input cycles during a known gate time or counts clock pulses during an unknown interval, and two things limit its accuracy: the ±1-count gating error and the error of its crystal time base. Oscilloscopes (analogue CRO and digital storage) show the waveform itself, so voltage, period, phase, frequency ratio (Lissajous figures) and rise time are read off the screen, while a spectrum analyser shows the same signal against frequency. The core relations are a count N with a ±1 error, phase = 360° × Δt/T, sin φ = y0/ym, the Lissajous tangency ratio, probe compensation RpCp = RsCs, rise time = 0.35/BW, and a DSO's sampling and aliasing rules.
5 previous-year questions · 5 solved · 5 practice questions
The universal counter-timer
A universal counter-timer is built from five blocks: an input conditioner (attenuator, amplifier and Schmitt trigger) that turns each cycle of the input into one clean pulse, a main gate (an AND gate), a chain of decade counting units that drive the display, a crystal time base with decade dividers, and control logic. Every mode uses the same hardware. The mode only decides which signal holds the gate open and which pulses are counted through it.
Mode
Gate held open by
Pulses counted
Reading
Frequency
Time base, for a gate time Tg (e.g. 0.01, 0.1, 1 or 10 s)
Input cycles
fx=N/Tg
Period
One input period, or M periods when averaging
Clock pulses at fc
Tx=N/(Mfc)
Time interval
A start event on channel A until a stop event on channel B
Clock pulses at fc
Δt=N/fc
Ratio
M cycles of the lower-frequency input B
Cycles of the higher-frequency input A
fA/fB=N/M
Totalise
Manual start and stop
Input events
N
FREQUENCY MODE
fx=TgN,resolution Δf=Tg1
N = input cycles counted in the gate time Tg. A 1 s gate reads to 1 Hz and a 10 s gate to 0.1 Hz.
PERIOD MODE (MULTIPLE-PERIOD AVERAGE)
Tx=MfcN
fc = clock (time-base) frequency and M = number of input periods the gate stays open for (M=1 for a single period). Averaging makes the resolution 1/(Mfc).
TIME-INTERVAL MODE
Δt=fcN
A start event on one channel opens the gate and a stop event on the other closes it (slope and trigger level are selectable). The resolution is one clock period, 1/fc.
Frequency mode suits high frequencies, where many input cycles fit in the gate. Period mode suits low frequencies, where many clock pulses fit in one period. A display of n full digits holds counts up to 10n−1. For example, a 10 MHz input with a 1 s gate gives N=107 and needs 8 digits, and a 10 s gate on the same input (N=108) would overflow them. Convention: every counter error below is a fraction of the reading (for errors this small, the reading and the true value give the same figure); multiply by 100 for per cent.
Counter errors and choosing the mode
Two errors are always present. The gating (±1-count) error arises because the gate is not synchronised with the pulses being counted, so the same interval can let through N or N±1 pulses. It is always ±1 count, so as a fraction of the reading it is ±1/N, and the only cure is a larger N. The time-base error is the fractional error of the crystal frequency, often quoted in ppm. If the crystal runs fast by a fraction ε, the gate is short by ε, so a frequency reading is low by ε; each clock pulse is also short by ε, so a period reading is high by ε. A longer gate does not reduce it.
Period and time-interval modes add a third error, the trigger error. Noise on the input shifts the instant at which the Schmitt trigger fires, by more when the signal's slope at the trigger point is small (slowly rising or small-amplitude inputs). Averaging over M periods divides the fractional trigger error by M, because only the start and stop edges carry it.
GATING ERROR (ANY MODE)
εg=±N1
As a fraction of the reading. The error is ±1 count whatever the input.
GATING ERROR IN FREQUENCY MODE
εg=±fxTg1
Large at low frequencies. A 50 Hz input with a 1 s gate gives N=50, which is an error of ±2%.
GATING ERROR IN PERIOD MODE
εg=±MfcTx1=±Mfcfx
Small at low frequencies. It grows with the input frequency.
Vn = peak noise voltage at the trigger instant and dv/dt = the signal's slope there. The start and the stop edge can each be displaced by Δttr, hence the factor 2 in this worst-case bound. For a sine of peak Vm triggered at its zero crossing, the slope is 2πfVm, which gives the last form.
TOTAL LIMITING ERROR
ε=±(N1+fcΔfc)
The worst-case (guaranteed) bound as a fraction of the reading. In period and time-interval modes, add the trigger error.
CROSSOVER (MODE-CHANGEOVER) FREQUENCY
fco=TgMfc(M=1:fco=fc/Tg)
The frequency at which the ±1-count error is the same in both modes, found by setting 1/(fTg)=f/(Mfc). Below fco, measure the period and invert it. Above it, measure frequency directly.
A reciprocal counter removes the choice of mode. It opens the gate on an input edge, keeps it open for a whole number M of input cycles lasting roughly the selected gate time Tg, counts clock pulses meanwhile, and computes fx=Mfc/N. Since N≈fcTg whatever the input frequency, its ±1-count error is about 1/(fcTg) at every frequency.
WORKED EXAMPLE
A universal counter has a 10 MHz crystal time base accurate to ±1 ppm and a 1 s gate. A 2 kHz signal is to be measured. Find the limiting error of the reading in (a) frequency mode, (b) single-period mode and (c) period mode averaged over 100 periods. (d) Find the crossover frequency for M=1.
▸ Solution
(a) N=fxTg=2000×1=2000. Gating error =±1/2000=±5×10−4. Total =±(5×10⁻⁴+1×10⁻⁶)=±5.01×10−4=±0.0501%, i.e. a reading of 2000±1.0 Hz.
(b) Tx=1/2000=0.5 ms, so N=fcTx=107×0.5×10−3=5000. Gating error =±2×10⁻⁴. Total =±2.01×10−4=±0.0201%.
(c) The gate stays open for 100×0.5 ms=50 ms, so N=107×0.05=5×10⁵. Displayed Tx=N/(Mfc)=5×105/(100×107)=0.5 ms. Gating error =±2×10⁻⁶. Total =±3×10−6=±0.0003%. The time-base error is now one third of the total, and averaging cannot remove it.
(d) fco=107/1≈3162 Hz. 2 kHz is below this, so period mode gives the smaller error, as parts (a) and (b) show.
The ±1 is one count, not a fixed percentage. Doubling the gate time halves the fractional gating error but leaves the time-base error unchanged. For the smallest error at a low frequency, use period mode with averaging and take the reciprocal: to first order, the fractional error of f=1/T has the same size as that of T.
EXAM TIP
Low-frequency trap: in frequency mode with a 1 s gate, 60 Hz reads 60 ± 1 Hz, an error of ±1.67%. In single-period mode with a 1 MHz clock, the same signal gives N≈16667 and an error of about ±0.006%.
The CRO: deflection and reading the screen
In a CRO, an electron beam accelerated through the anode voltage Va passes between a pair of deflecting plates of length ld and spacing d, with voltage Vd across them. Between the plates the beam follows a parabola. After leaving them it travels in a straight line to the screen, a distance L from the centre of the plates. The signal (through the Y amplifier) drives the Y (vertical-deflection) plates, and the sawtooth time base drives the X (horizontal-deflection) plates, so the screen shows voltage against time.
ELECTRON VELOCITY AFTER ACCELERATION
v0x=m2eVa
Non-relativistic. e=1.602×10⁻¹⁹ C and m=9.109×10⁻³¹ kg. The beam crosses the plates in ld/v0x; this transit time must be a small fraction of the signal period, which is one limit on a CRT's bandwidth.
ELECTROSTATIC DEFLECTION ON THE SCREEN
D=2dVaLldVd
L is measured from the centre of the plates to the screen. Assumes a uniform field between the plates (no fringing), a small deflection angle and a beam that clears the plates. e/m cancels, so the deflection does not depend on it.
DEFLECTION SENSITIVITY AND DEFLECTION FACTOR
S=VdD=2dVaLld(m/V),G=S1=Lld2dVa(V/m)
Convention used here: sensitivity is deflection per volt, and the deflection factor is volts per unit deflection (the V/div knob sets a deflection factor). Doubling Va halves the sensitivity.
MAGNETIC DEFLECTION (FOR COMPARISON)
D=LlB2mVae
Uniform flux density B over an axial length l,L measured from the centre of the field region to the screen, small deflection. Unlike electrostatic deflection, it depends on e/m and falls only as 1/Va. CROs use electrostatic deflection because deflection coils, being inductive, cannot follow high signal frequencies.
EXAM TIP
A common trap is to assume that a higher accelerating voltage increases deflection. It does the opposite. A faster beam gives a brighter trace and a higher writing speed, but it is harder to deflect, so the electrostatic sensitivity falls as 1/Va.
READING THE GRATICULE
Vpp=nv×divV×kprobe,T=nh×divtime,f=T1
nv and nh are numbers of divisions. kprobe = probe attenuation (10 for a 10:1 probe, unless the scope already corrects for it). For a sine, Vrms=Vpp/(22).
CYCLES SHOWN BY A FREE-RUNNING SWEEP
n=fsweepfy
Retrace time neglected. The display is stationary only when fy is an integer multiple of the sweep frequency. A triggered sweep achieves this automatically by starting every sweep at the same point on the signal.
Triggering. The trigger circuit starts each sweep when the signal crosses a set level with a set slope (rising or falling), so every sweep begins at the same point on the waveform. Because the trigger circuit and the sweep take a short time to start, the vertical channel includes a delay line: the signal reaches the Y plates slightly after the sweep has begun, so the edge that triggered the sweep is visible on the screen.
A dual-trace scope shares one beam between two channels, in one of the two modes below. A dual-beam scope has two independent beams and can capture two single-shot events at the same instant.
Dual-trace mode
How it works
Use for
Alternate
One complete sweep of channel A, then one complete sweep of channel B
Fast sweeps (higher-frequency signals), where the switching between traces is not visible
Chopped
The beam switches between A and B at a fixed high rate within every sweep
Slow sweeps (low-frequency signals), where alternate mode would visibly flicker
Phase measurement and Lissajous figures
The phase difference between two sinusoids of the same frequency is a time delay expressed as a fraction of one period. Measure the delay between corresponding points (for example, the positive-going zero crossings) on a dual-trace oscilloscope, or with a counter in time-interval mode, then scale by 360° per period. Convention: if waveform B reaches the reference point Δt after waveform A, B lags A.
PHASE FROM TIME DELAY
ϕ=360∘×TΔt=360∘fΔt
Δt is the delay between corresponding points and T the common period. On a CRO, Δt/T = (divisions of delay)/(divisions per cycle), so the time/div setting cancels.
PHASE WITH A COUNTER
ϕ=360∘×NTNΔt
Count clock pulses during the delay (NΔt) and during one period (NT) with the same clock. The clock frequency cancels.
FLIP-FLOP (SET–RESET) PHASE DETECTOR
Vavg=VH360∘ϕ,0∘≤ϕ<360∘
The output switches between 0 and VH. The positive-going zero crossing of the reference sets the flip-flop and the positive-going zero crossing of the other signal resets it, so the duty cycle is ϕ/360∘, where ϕ is the lag of the other signal behind the reference. The reading is unambiguous over the full circle: a 30° lag reads 30° and a 30° lead reads 330°.
XOR PHASE DETECTOR
Vavg=VH180∘ϕ,0∘≤ϕ≤180∘
The output switches between 0 and VH. Both inputs must be square waves of 50% duty cycle (sinusoids are squared first by comparators). The output is high whenever the inputs differ, which happens twice per cycle. For 180∘≤ϕ≤360∘ the output is VH(360∘−ϕ)/180∘, so the detector cannot tell a lag of ϕ from a lead of ϕ.
EXAM TIP
Time both waves from the same kind of point, such as both positive-going zero crossings. Peaks make poor timing points because a sine is flat there, so a little noise gives a large timing error. The slope is steepest at the zero crossings, which makes them the best reference. In alternate mode, trigger both traces from the same (reference) channel; triggering each trace from its own signal destroys the time relation between them.
To get a Lissajous figure, switch the internal time base off, drive the X plates with one sinusoid and the Y plates with another. When the two frequencies are in a ratio of small whole numbers, the spot traces a stationary closed figure. The figure gives the frequency ratio (an unknown against a known standard) or, for equal frequencies, the phase difference.
Apply the known frequency fx to the horizontal input and the unknown fy to the vertical input, with the time base off.
Adjust fx until the pattern stands still.
Draw a horizontal line tangent to the top (or bottom) of the figure and count the points where the figure touches it: nh.
Draw a vertical line tangent to one side of the figure and count the points where the figure touches it: nv.
Then fy/fx=nh/nv. Equivalently, draw a horizontal line and a vertical line through the figure, away from its self-intersections: fy/fx = (crossings of the horizontal line)/(crossings of the vertical line).
LISSAJOUS FREQUENCY RATIO
fxfy=nvnh
fy is on the Y (vertical) input and fx on the X (horizontal) input. nh = points touching a horizontal tangent; nv = points touching a vertical tangent. For an open figure whose ends are retraced, each free end counts as ½.
LISSAJOUS PHASE (SAME FREQUENCY)
sinϕ=ymy0=xmx0
y0 = the distance from the centre to the point where the ellipse cuts the Y axis (half the chord on the Y axis); ym = the maximum vertical deflection. The ratio of full chord to full height is the same. Centre the figure first, and assume the X and Y amplifiers add equal phase shifts. This gives the size of φ only, not whether Y leads or lags, and sinϕ alone cannot separate φ from 180∘−ϕ: the quadrants of the major axis decide.
ELLIPSE AXES, EQUAL DEFLECTIONS
tan2ϕ=ab(0∘≤ϕ≤90∘),tan2ϕ=ba(90∘≤ϕ≤180∘)
a and b are the major and minor semi-axes. Valid only when both deflections have equal peak amplitude. For ϕ<90∘ the major axis lies in the first and third quadrants; for ϕ>90∘, in the second and fourth. The quadrant rules in the table below hold for any amplitudes; only the circle needs equal deflections.
Phase difference
Figure
0∘
Straight line through the first and third quadrants
0∘<ϕ<90∘ (or 270∘ to 360∘)
Ellipse with its major axis in the first and third quadrants
90∘ (or 270∘)
Circle if the two deflections are equal; otherwise an ellipse with its axes along X and Y
90∘<ϕ<180∘ (or 180∘ to 270∘)
Ellipse with its major axis in the second and fourth quadrants
180∘
Straight line through the second and fourth quadrants
Intensity (Z-axis) modulation is a second comparison method. A circle is formed at a known frequency fref by applying it to the X input directly and to the Y input through a 90° phase-shift network, with equal deflections. The unknown fz drives the Z (intensity) input, which brightens the trace during one half of each of its cycles and dims it during the other, so the circle breaks into bright and dark segments. The pattern is stationary when fz is a whole multiple of fref.
Z-MODULATION FREQUENCY RATIO
freffz=n
n = number of bright (or of dark) segments around the circle.
WORKED EXAMPLE
(a) A 600 Hz reference is applied to the horizontal input of a CRO and an unknown sinusoid to the vertical input. The stationary pattern touches a horizontal tangent at 2 points and a vertical tangent at 5 points. Find the unknown frequency. (b) Two sinusoids of the same frequency are then applied. The resulting ellipse cuts the Y axis at ±2.5 div, its maximum vertical deflection is ±4.0 div, and its major axis lies in the first and third quadrants. Find the phase difference.
▸ Solution
(a) fy/fx=nh/nv=2/5.
fy=600×2/5=240 Hz.
(b) sinϕ=y0/ym=2.5/4.0=0.625.
ϕ=sin−1(0.625)=38.7∘. A major axis in the first and third quadrants confirms that φ lies between 0° and 90°. The figure cannot tell whether Y leads or lags.
Answer: (a) 240 Hz (b) 38.7°
EXAM TIP
Don't swap the counts. The frequency on the Y input goes with the count on the horizontal tangent. A pattern that touches a horizontal line 3 times and a vertical line once means fy=3fx, not fx=3fy. Also, sinϕ=0.5 gives 30° or 150°, so use the quadrants of the major axis to pick one.
Probes, bandwidth and rise time
A 10:1 passive probe puts a 9 MΩ resistor in series with the scope's 1 MΩ input. It divides the signal by 10 at DC and presents 10 MΩ to the circuit. The scope input also has shunt capacitance (input plus cable), which on its own would make the division depend on frequency. In the standard model, a small adjustable capacitor Cp across the 9 MΩ resistor corrects this: when the two RC time constants are equal, the divider ratio is the same at every frequency.
PROBE COMPENSATION CONDITION
RpCp=RsCs
Rp and Cp = the probe's series resistance and its trimmer capacitor; Rs and Cs = the scope's input resistance and total shunt capacitance (input plus cable). When compensated, the attenuation Rs/(Rp+Rs) holds at every frequency.
COMPENSATED K:1 PROBE AS SEEN BY THE CIRCUIT
Rin=Rp+Rs=kRs,Cin=Cp+CsCpCs=kCs
Loading falls by the attenuation factor. For a 10:1 probe, the circuit sees ten times the resistance and one tenth of the capacitance of the bare scope input. With a source resistance Rsrc≪Rin,Cin forms a low-pass filter that adds a rise time of about 2.2RsrcCin.
LOW- AND HIGH-FREQUENCY DIVIDER RATIOS
ViVoDC=Rp+RsRs,ViVof→∞=Cp+CsCp
These are equal only when the probe is compensated. With Cp too large, the high-frequency gain is too high (overshoot). With Cp too small, it is too low (rounded edges).
Trimmer setting
Condition
1 kHz square wave on screen
Correct
RpCp=RsCs
Flat tops and square corners
Over-compensated
RpCp>RsCs (Cp too large)
Overshoot spike at each edge, decaying to the correct level
Under-compensated
RpCp<RsCs (Cp too small)
Rounded leading corners, rising slowly to the correct level
RISE TIME AND BANDWIDTH
tr=BW0.35
10%–90% rise time of a single-pole (first-order) response, from tr=2.2τ and BW=1/(2πτ). Use 0.35 unless the question gives another constant.
CASCADED RISE TIMES
tr,disp=tr,sig2+tr,scope2+tr,probe2
Root-sum-square rule for cascaded stages with little or no overshoot. It is an approximation (exact for Gaussian responses). To find the true rise time of the signal, subtract the squares.
SINGLE-POLE AMPLITUDE RESPONSE
VtrueVdisp=1+(f/BW)21
At f=BW the display shows 70.7% (−3 dB) of the true amplitude.
WORKED EXAMPLE
A pulse viewed on a 100 MHz oscilloscope (single-pole response, so tr=0.35/BW; probe effect negligible) shows a 10–90% rise time of 5.0 ns. Find (a) the true rise time of the pulse and (b) the minimum oscilloscope bandwidth that keeps the displayed rise time within 2% of the true value.
▸ Solution
tr,scope=0.35/(100×106)=3.5 ns.
(a) tr,sig=5.02−3.52=12.75=3.57 ns.
(b) We need tsig2+tscope2≤1.02tsig, so tscope≤tsig1.022−1=3.57×0.201=0.718 ns.
BW≥0.35/(0.718×10−9)≈488 MHz, i.e. the scope must rise about five times faster than the signal.
Answer: (a) 3.57 ns (b) about 488 MHz
EXAM TIP
A rule of thumb follows from the root-sum-square rule. A scope that rises 3 times faster than the signal shows a rise time about 5% too long; one that rises 5 times faster shows it about 2% too long. Compensate the probe against the scope's own calibrator square wave whenever you move it to another scope or channel, because Cs differs from input to input.
Digital storage oscilloscope: sampling, aliasing, record length
A DSO passes the input through an analogue front end (attenuator, and an amplifier with a stated analogue bandwidth), samples it with an ADC at rate fs, and stores the samples in an acquisition memory of fixed record length N. The trace is rebuilt from memory. The scope can therefore hold a single-shot event, show what happened before the trigger (pre-trigger view) and run measurements and FFTs on the stored record. What it cannot do is show correctly a frequency it did not sample fast enough.
SAMPLING THEOREM
fs>2fmax
For a signal with no components above fmax. The inequality is strict: at exactly 2f, every sample can fall on a zero crossing. In practice a real-time DSO samples well above 2fmax so that the reconstructed trace is accurate; a common rule of thumb is at least 2.5 samples per cycle of the highest frequency with sinx/x interpolation and about 10 with linear interpolation.
ALIAS FREQUENCY
fa=∣fin−kfs∣,k=integer nearest to fin/fs,0≤fa≤2fs
Any input above fs/2 that is still inside the analogue bandwidth (with no anti-aliasing filter) is displayed at fa. For example, a 1.02 MHz sine sampled at 1 MS/s appears as a 20 kHz sine.
For a 10-division screen filled by the record. With a fixed memory, a slower time base forces a lower sample rate, which is how aliasing appears at slow sweeps.
VERTICAL RESOLUTION
ΔV=2nVFS
For an n-bit ADC, taking one step as VFS/2n (some texts divide by 2n−1; the difference is negligible for large n). An 8-bit ADC gives 256 levels, so one step on a 10 V full-scale range is 39 mV.
FFT FREQUENCY RESOLUTION
Δf=Nfs=Twindow1
The bin spacing of an N-point FFT, which covers 0 to fs/2.
Aspect
Real-time sampling
Equivalent-time sampling
Signal
Any signal, including a single shot
Repetitive signals only
How
The whole record is taken in one acquisition at fs
A few samples per trigger, each acquisition shifted in time (sequential) or taken at random times after the trigger (random); the record builds up over many cycles
Limit
The analogue bandwidth, and for a single shot the sampling theorem: only components below fs/2 are captured correctly
Effective sample rate far above the ADC rate; bandwidth is limited by the front end
EXAM TIP
To test for aliasing, change the time/div by one step. A real signal keeps the same frequency on the readout, while an alias changes frequency and often will not trigger stably. Peak-detect mode samples at the full ADC rate and keeps the maximum and minimum found in each interval between stored points, so narrow glitches are not missed at slow sweeps.
Spectrum analysers
An oscilloscope shows amplitude against time. A spectrum analyser shows amplitude (usually in dB) against frequency, which makes harmonics, distortion products, noise, and small signals next to large ones visible. A swept (superheterodyne) analyser mixes the input with a local oscillator (LO) that sweeps across the span. Whatever input component lands at the fixed intermediate frequency (IF) passes a narrow IF filter, whose width is the resolution bandwidth (RBW). That component is detected and plotted at the horizontal position that corresponds to the current LO tuning. An FFT analyser instead digitises a block of the signal and computes its whole spectrum at once.
SUPERHETERODYNE TUNING
fin=fLO−fIF,fimage=fin+2fIF
For an LO above the input (high-side LO). The image frequency also mixes down to fIF; an input filter or a high first IF keeps it out.
RESOLUTION BANDWIDTH AND NOISE FLOOR
ΔLnoise=10log10RBW1RBW2dB
Change in the displayed noise level when the RBW is changed from RBW1 to RBW2 (negative means lower). Displayed noise power is proportional to the RBW, so a 10× narrower RBW lowers the noise floor by 10 dB, while a sinusoid's displayed level stays the same, so small tones emerge from the noise. Two equal tones closer together than about one RBW merge into a single peak.
SWEEP TIME
Tsweep≈kRBW2Span
k is about 2–3 for analogue IF filters. Halving the RBW makes the sweep four times slower.
POWER IN DBM
PdBm=10log101mWP,0dBm↔0.224V rms in 50Ω
Levels are shown relative to 1 mW. Convert to voltage with the system impedance, usually 50 Ω.
HARMONIC DISTORTION FROM A SPECTRUM
THD=V1V22+V32+⋯,V1Vn=10(Ln−L1)/20
Vn = rms value of the nth harmonic; Ln = its level in dB read off the display. This THD is relative to the fundamental unless it is stated as a percentage of the total rms.
AM SIDEBANDS ON A SPECTRUM ANALYSER
LSB−Lcar=20log102mdB
Single-tone AM with modulation index m (0<m≤1) shows the carrier at f0 and one line at each of f0±fm, each sideband of amplitude mVcar/2. For m=1 each sideband is 6.0 dB below the carrier; for m=0.5, 12.0 dB below.
Aspect
Swept (superheterodyne)
FFT
Frequency range
Very wide, into RF and microwave
Up to fs/2 of its ADC
Resolution set by
The RBW of the IF filter
Δf=fs/N=1/Twindow, plus the window shape
Phase information
No, magnitude only
Yes, the FFT gives magnitude and phase
Transients
Missed unless present while the sweep is at that frequency
The whole band is captured at once, which suits transients
EXAM TIP
If the FFT record does not hold a whole number of cycles, a pure tone leaks into neighbouring bins. A tapering window reduces the leakage at the cost of a wider main peak; among the common windows, a flat-top window gives the most accurate amplitude reading. On a swept analyser, a narrower RBW separates close tones and lowers the noise floor, but the sweep gets slower.
PREVIOUS-YEAR QUESTIONS
5 questions from the IN papers
Try each question first, then open the answer. We placed each question under a topic ourselves; the exam paper does not label topics.
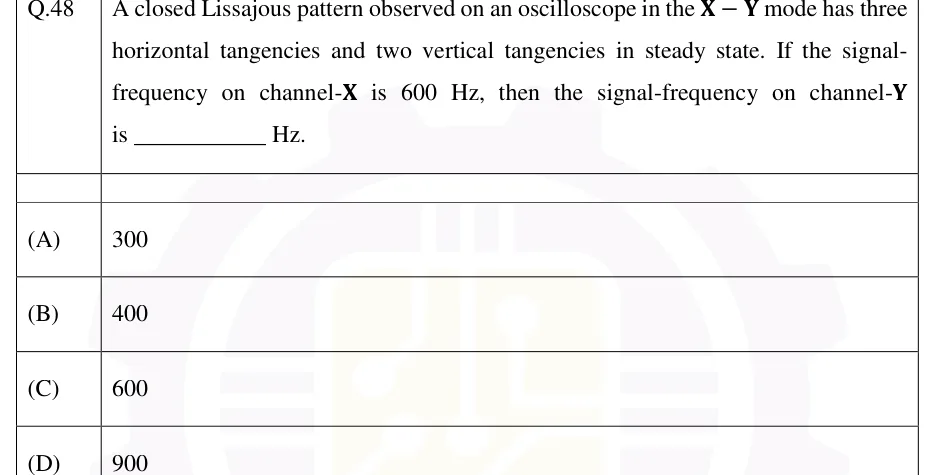
A closed Lissajous pattern observed on an oscilloscope in the X−Y mode has three horizontal tangencies and two vertical tangencies in steady state. If the signal-frequency on channel-X is 600 Hz, then the signal-frequency on channel-Y is ________ Hz.
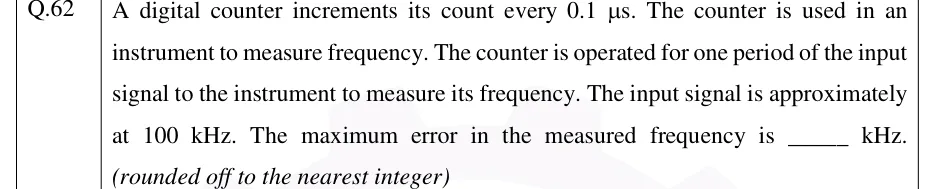
A digital counter increments its count every 0.1 μs. The counter is used in an instrument to measure frequency. The counter is operated for one period of the input signal to the instrument to measure its frequency. The input signal is approximately at 100 kHz. The maximum error in the measured frequency is ______ kHz. (rounded off to the nearest integer)
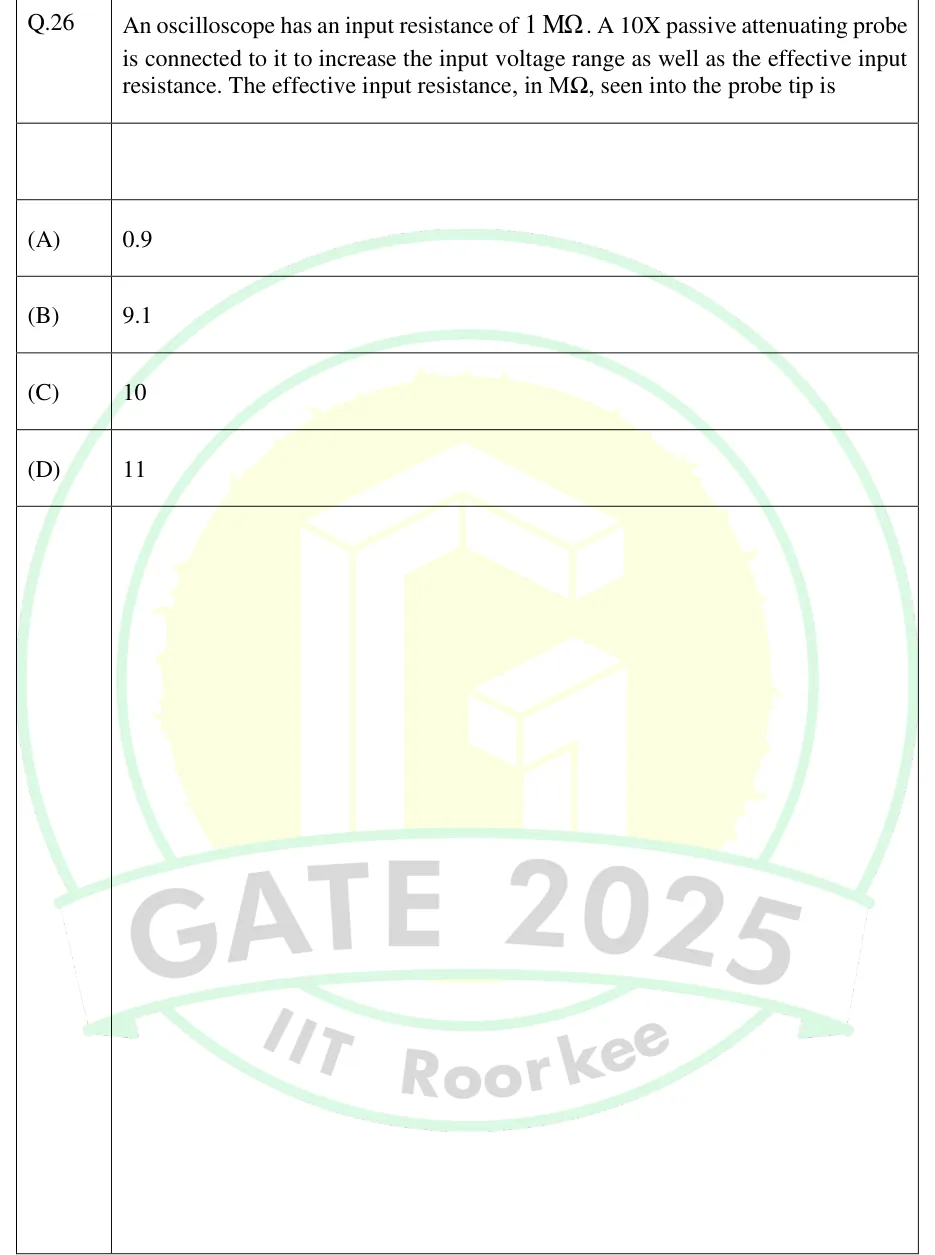
An oscilloscope has an input resistance of 1MΩ. A 10X passive attenuating probe is connected to it to increase the input voltage range as well as the effective input resistance. The effective input resistance, in MΩ, seen into the probe tip is
A 621 digit timer-counter is set in the 'time period' mode of operation and the range is set as 'ns'. For an input signal, the timer-counter displays 1000000. With the same input signal, the timer-counter is changed to 'frequency' mode of operation and the range is set as 'Hz'. The display will show the number ____
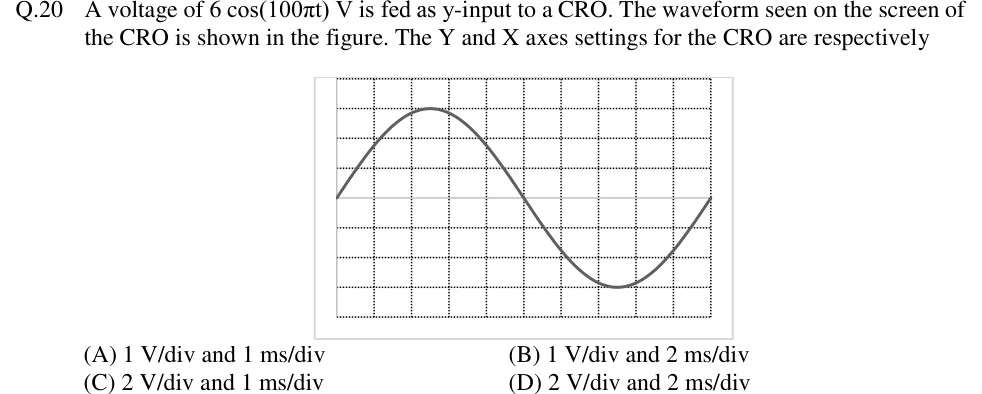
A voltage of 6cos(100πt) V is fed as y-input to a CRO. The waveform seen on the screen of the CRO is shown in the figure. The Y and X axes settings for the CRO are respectively
Tap to open full sizeFigure from the GATE 2018 IN paper. It is part of the question.Figure description
CRO screen graticule with 10 horizontal divisions and 8 vertical divisions (dotted grid lines), the horizontal centre line at 4 divisions from the top/bottom. One sinusoid is displayed: it starts at the left edge on the centre line going upward, reaches its positive peak 3 divisions above the centre line at about 2.5 divisions from the left, crosses the centre line going downward at the 5th vertical division (screen middle), reaches its negative peak 3 divisions below the centre line at about 7.5 divisions, and returns to the centre line at the right edge (10th division). So exactly one full cycle fills the 10 horizontal divisions and the peak-to-peak height is 6 divisions.
A dual-trace oscilloscope is set to 0.5 ms/div. Two sinusoids of the same frequency each complete one cycle in 8.0 divisions. The positive-going zero crossing of trace B occurs 1.2 divisions after that of trace A. The angle, in degrees, by which B lags A is ____.
▸ Answer and solution
Answer:54 (accepted range ±0.5)
Phase = 360° × (divisions of delay)/(divisions per cycle); the time/div setting cancels.
ϕ=360∘×1.2/8.0=54∘.
Check: T=8×0.5=4 ms, so f=250 Hz; Δt=0.6 ms; 360∘×250×0.6×10−3=54∘. B crosses later, so B lags A by 54°.
PRACTICE 22 marks · MSQ
A DSO with no anti-aliasing filter has a maximum real-time sample rate of 500 MS/s, an analogue bandwidth of 100 MHz and a record length of 10 000 points. Whenever its maximum sample rate allows, it spreads the whole record across the 10 horizontal divisions. Which of the following statements are correct?
(A)
At 2 ms/div, the sample rate is 500 kS/s.
(B)
At 2 ms/div, a 505 kHz sinusoid is displayed as a 5 kHz sinusoid.
(C)
At 1 μs/div, the sample rate is 1 GS/s.
(D)
At 2 ms/div, an FFT computed over the whole record has a frequency resolution of 50 Hz.
▸ Answer and solution
Answer: (A), (B), (D)
At 2 ms/div the window is 20 ms, so fs=104/0.02=500 kS/s, within the 500 MS/s limit. (A) is correct.
Half the sample rate is 250 kHz, and 505 kHz is inside the 100 MHz bandwidth with no filter to stop it, so it aliases: k=1 and fa=∣505−500∣=5 kHz. (B) is correct.
At 1 μs/div the window is 10 μs, which would need 104/10−5=1 GS/s. That exceeds 500 MS/s, so the rate is capped at 500 MS/s. (C) is wrong.
Δf=fs/N=5×105/104=50 Hz =1/(20 ms). (D) is correct.
PRACTICE 32 marks · NAT
A universal counter has a 10 MHz crystal time base whose error is negligible. A 400 Hz sinusoid is measured (i) in frequency mode with a 1 s gate and (ii) in period mode averaged over 10 periods. The worst-case ±1-count (gating) error in each case is expressed as a fraction of the reading. The ratio of the error in (i) to the error in (ii) is ____.
▸ Answer and solution
Answer:625 (accepted range ±1)
(i) N=400×1=400, so the error is 1/400=2.5×10−3.
(ii) The gate stays open for 10×2.5 ms=25 ms, so N=25×10−3×107=2.5×10⁵ and the error is 4×10⁻⁶.
Ratio =2.5×10⁻³/(4×10−6)=625.
PRACTICE 41 mark · MCQ
Two sinusoids of the same frequency are applied to the X and Y inputs of a CRO with the time base off. The centred ellipse cuts the Y axis at +3.0 div and −3.0 div, its maximum vertical deflection is ±6.0 div, and its major axis lies in the second and fourth quadrants. The phase difference between the signals, taken in the range 0° to 180°, is
(A)
30°
(B)
60°
(C)
120°
(D)
150°
▸ Answer and solution
Answer: (D)
sinϕ=y0/ym=3.0/6.0=0.5, so ϕ=30∘ or 150∘.
A major axis in the second and fourth quadrants means 90∘<ϕ<180∘.
Therefore ϕ=150∘.
PRACTICE 52 marks · MCQ
A 10:1 passive probe (series resistance 9 MΩ, shunted by an adjustable capacitor Cp) is used with an oscilloscope whose input is 1 MΩ in parallel with 25 pF, cable capacitance included. For correct compensation, the value of Cp and the capacitance presented to the circuit under test are, respectively,
(A)
2.78 pF and 2.50 pF
(B)
225 pF and 22.5 pF
(C)
2.78 pF and 27.8 pF
(D)
2.50 pF and 25.0 pF
▸ Answer and solution
Answer: (A)
Compensation requires RpCp=RsCs, so Cp=(1/9)×25=2.78 pF.
The circuit sees Cp in series with Cs:2.78+252.78×25=2.50 pF, which equals Cs/10 as expected for a compensated 10:1 probe.