
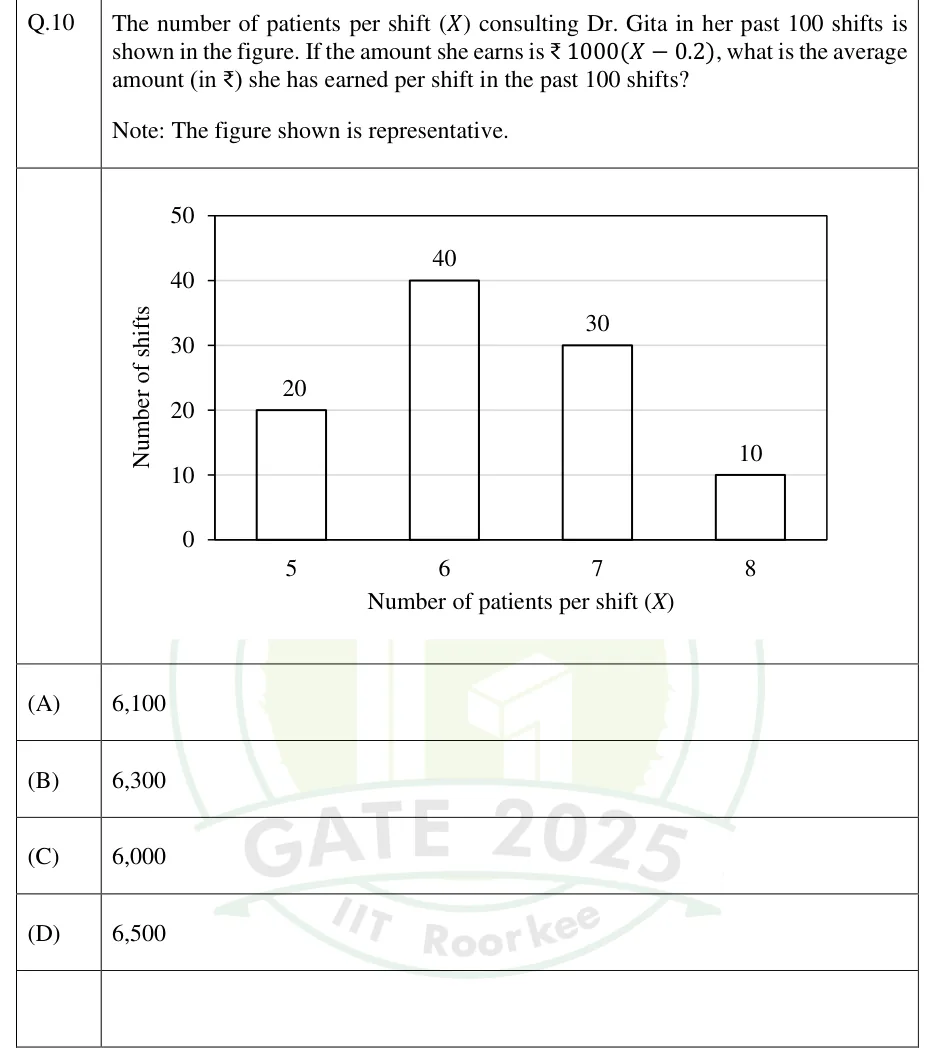
The number of patients per shift () consulting Dr. Gita in her past 100 shifts is shown in the figure. If the amount she earns is Rs. , what is the average amount (in Rs.) she has earned per shift in the past 100 shifts?
Note: The figure shown is representative.
 Tap to open full size
Figure description
Bar chart with unfilled bars. The vertical axis is titled 'Number of shifts' with gridlines at 0, 10, 20, 30, 40, 50. The horizontal axis is titled 'Number of patients per shift (X)' with four categories 5, 6, 7, 8. Bar heights, each labelled above the bar: X = 5 has 20 shifts, X = 6 has 40 shifts, X = 7 has 30 shifts, X = 8 has 10 shifts.
- (A)
6,100
- (B)
6,300
- (C)
6,000
- (D)
6,500