
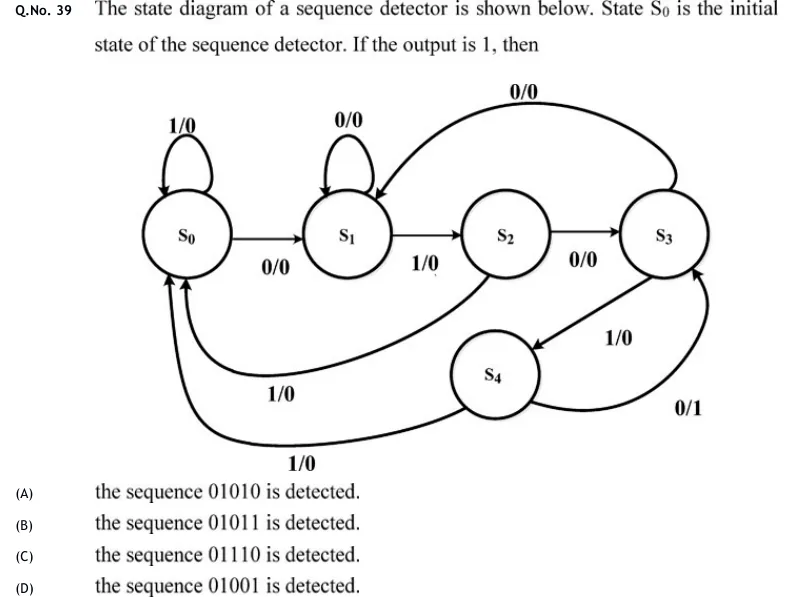
The state diagram of a sequence detector is shown below. State is the initial state of the sequence detector. If the output is 1, then
 Tap to open full size
Figure description
Mealy state diagram with five states S0, S1, S2, S3, S4. S0, S1, S2 and S3 sit in a row from left to right, and S4 sits below, between S2 and S3. Each edge is labelled input/output. Edges: S0 has a self-loop labelled 1/0; S0 -> S1 labelled 0/0; S1 has a self-loop labelled 0/0; S1 -> S2 labelled 1/0; S2 -> S3 labelled 0/0; S2 -> S0 labelled 1/0 (a curve running under the row back to S0); S3 -> S1 labelled 0/0 (a curve running over the top from S3 back to S1); S3 -> S4 labelled 1/0; S4 -> S3 labelled 0/1 (a curve from the lower-right side of S4 up to the lower-right of S3); S4 -> S0 labelled 1/0 (a long curve along the bottom back to S0).
- (A)
the sequence 01010 is detected.
- (B)
the sequence 01011 is detected.
- (C)
the sequence 01110 is detected.
- (D)
the sequence 01001 is detected.