
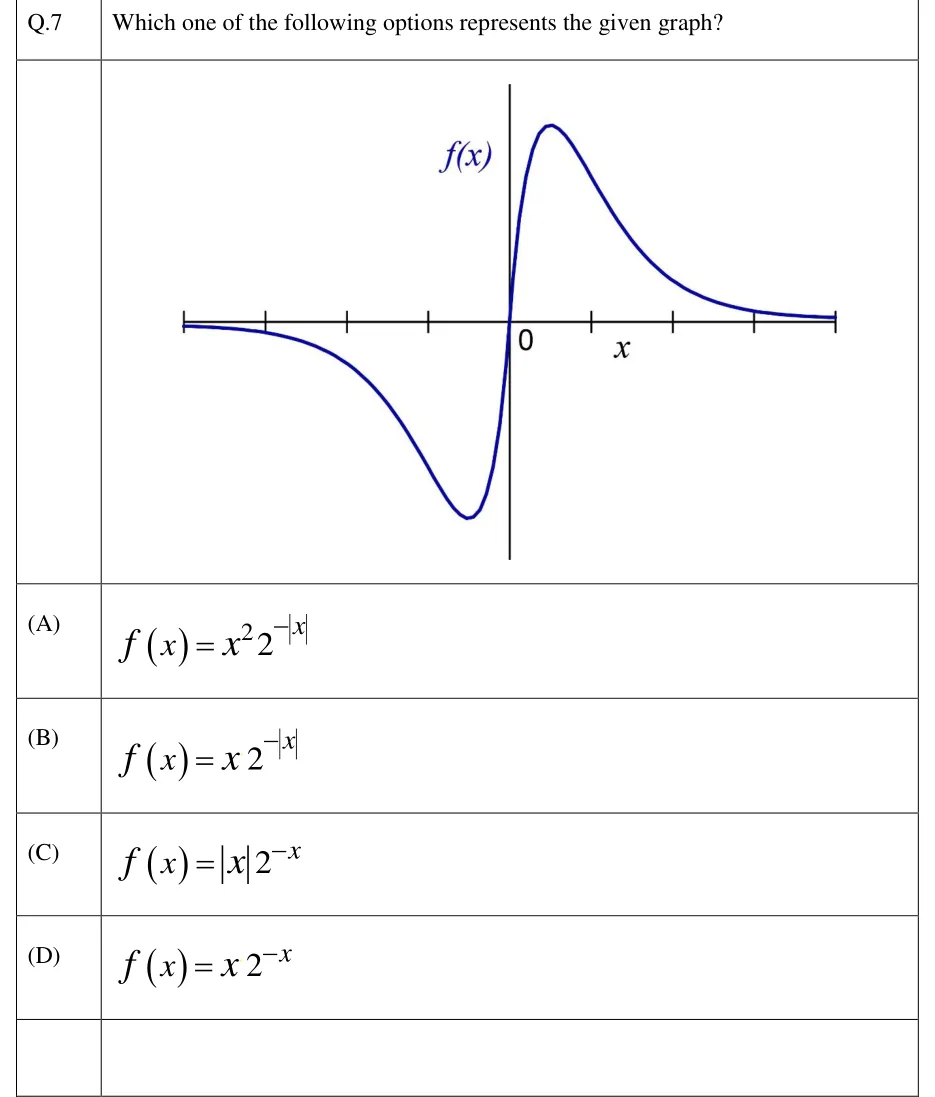
Which one of the following options represents the given graph?
 Tap to open full size
Figure description
A plot of f(x) against x. A horizontal x-axis runs across the figure with equally spaced tick marks: four ticks to the left of the origin and four to the right (the outermost tick on each side is drawn as a small end bar). The origin is labelled 0 just below and to the right of where the axes cross, and the axis is labelled x below it, to the right of the origin. A vertical axis through the origin is labelled f(x) at its upper left. No numerical values are printed on either axis. The curve (dark blue) is antisymmetric about the origin. At the far left it starts just below the x-axis, very close to zero. Moving right it bends further below the axis and reaches a sharp minimum a short distance left of the origin (about half a tick spacing). It then rises steeply, crosses the axis at the origin, and reaches a sharp maximum a short distance right of the origin (about half a tick spacing) at a height equal to the depth of the minimum. After that it decays smoothly and stays above the x-axis, approaching zero at the far right. The curve is negative for every x < 0, zero at x = 0, positive for every x > 0, and tends to 0 as x goes to plus or minus infinity.
- (A)
- (B)
- (C)
- (D)