
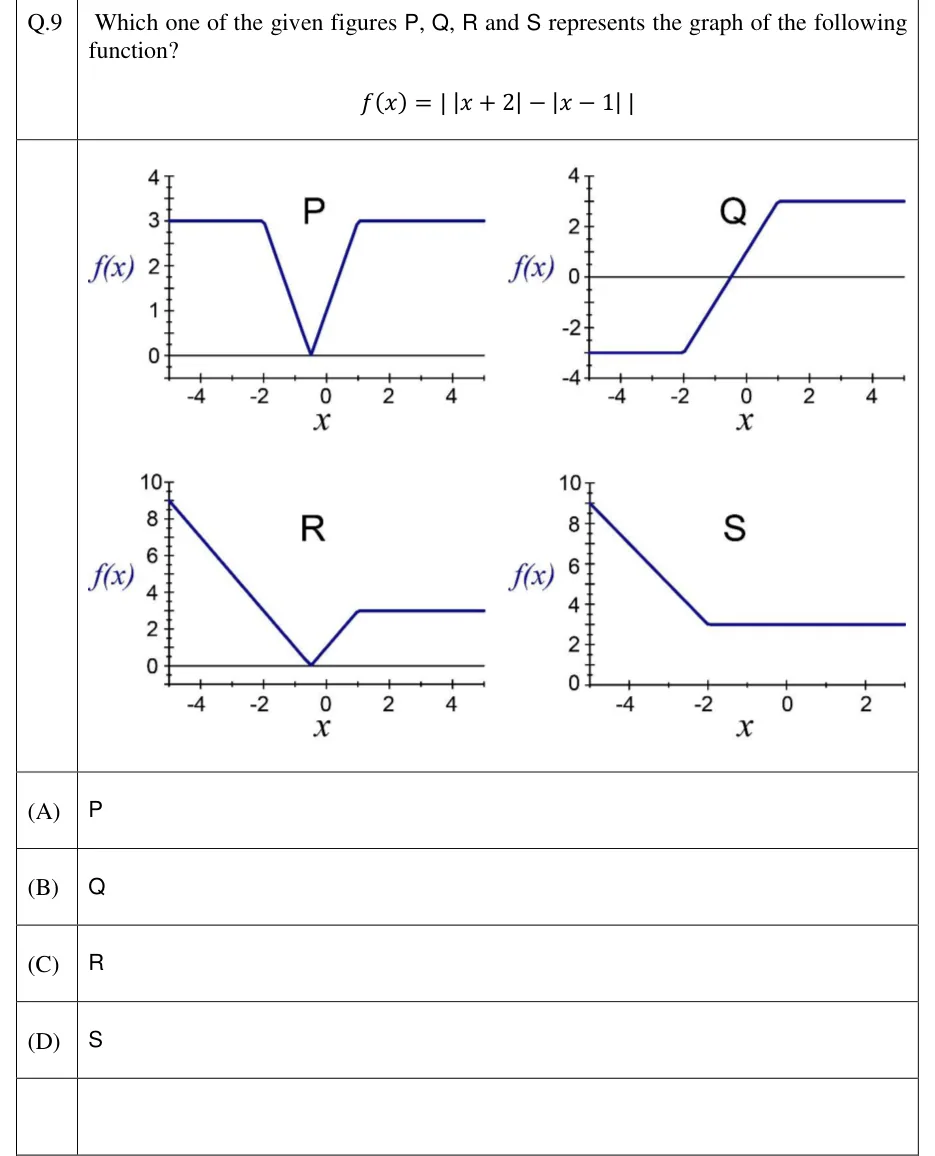
Which one of the given figures P, Q, R and S represents the graph of the following function?
 Tap to open full size
Figure description
Four graphs arranged in a 2 x 2 grid, each a thick blue piecewise-linear curve on axes labelled f(x) (vertical) and x (horizontal), with the letter of the figure printed near the top. Top left, P: vertical axis from 0 to 4 with labels 0, 1, 2, 3, 4; horizontal axis from about -5 to 5 with labels -4, -2, 0, 2, 4; a thin horizontal line at f(x) = 0. The curve is flat at f(x) = 3 from the left edge to x = -2, falls in a straight line to f(x) = 0 at x = -0.5, rises in a straight line to f(x) = 3 at x = 1, then stays flat at 3 to the right edge (a V-shaped notch between two level arms at height 3). Top right, Q: vertical axis from -4 to 4 with labels -4, -2, 0, 2, 4; horizontal axis from about -5 to 5 with labels -4, -2, 0, 2, 4; a thin horizontal line at f(x) = 0. The curve is flat at f(x) = -3 from the left edge to x = -2, rises in a straight line through f(x) = 0 at x = -0.5 to f(x) = 3 at x = 1, then stays flat at 3 to the right edge (a ramp between two level arms at -3 and 3). Bottom left, R: vertical axis from 0 to 10 with labels 0, 2, 4, 6, 8, 10; horizontal axis from about -5 to 5 with labels -4, -2, 0, 2, 4; a thin horizontal line at f(x) = 0. The curve starts at about (-5, 9), falls in a straight line to f(x) = 0 at x = -0.5, rises in a straight line to f(x) = 3 at x = 1, then stays flat at 3 to the right edge. Bottom right, S: vertical axis from 0 to 10 with labels 0, 2, 4, 6, 8, 10; horizontal axis from about -5 to 3 with labels -4, -2, 0, 2. The curve starts at about (-5, 9), falls in a straight line to f(x) = 3 at x = -2, then stays flat at 3 to the right edge; it never touches zero.
- (A)
P
- (B)
Q
- (C)
R
- (D)
S