
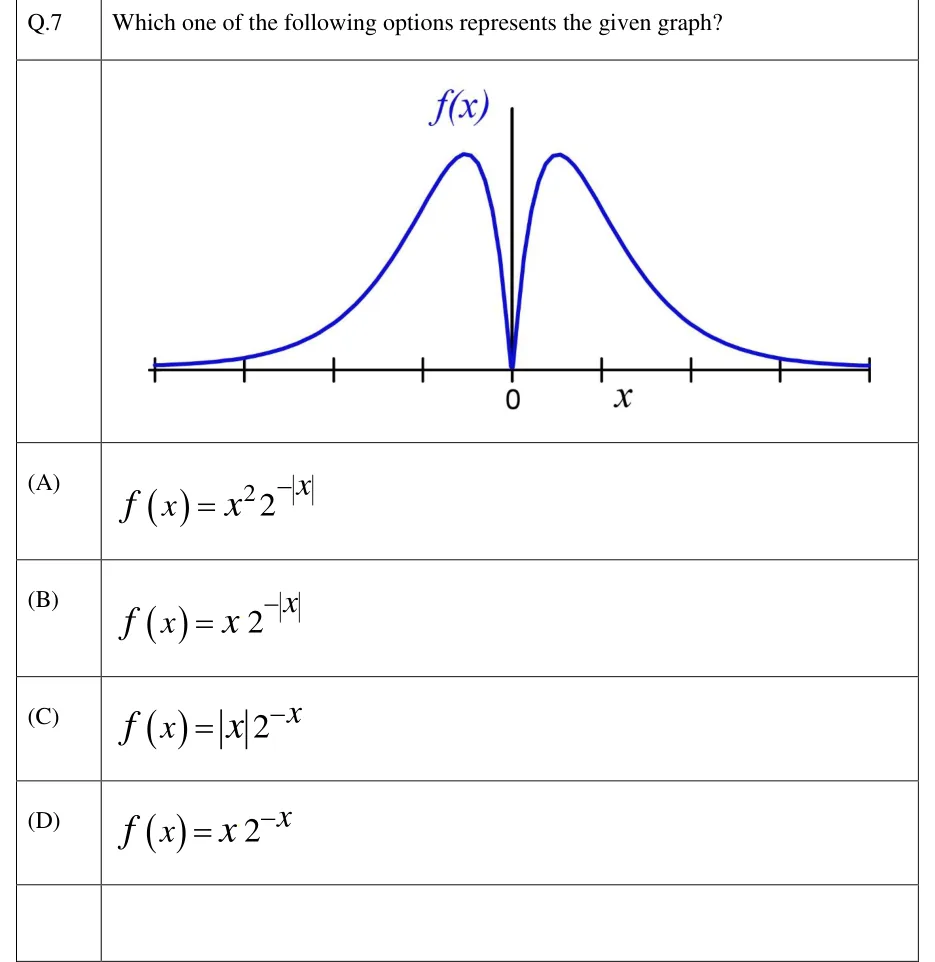
Which one of the following options represents the given graph?
 Tap to open full size
Figure description
A graph of f(x) against x. A horizontal x-axis runs across the figure, with 9 equally spaced unlabelled tick marks: the centre tick is labelled 0, with 4 ticks to its left and 4 to its right. The label x sits just below the axis to the right of 0. A vertical axis labelled f(x) passes up through 0. A single solid blue curve is drawn, symmetric about the vertical axis. It touches the x-axis only at the origin, where it comes to a sharp V-shaped minimum of value 0. From the origin it rises steeply on each side to a maximum at about half a tick-spacing from the vertical axis (one peak left of it, one right of it, at equal height). Beyond each peak it falls away smoothly, in a bell-shaped tail, towards the x-axis, and is almost touching the axis at the outermost ticks on both ends. The curve is never below the x-axis.
- (A)
- (B)
- (C)
- (D)