
For a MOS capacitor, and are the flat-band voltage and the threshold voltage, respectively. The variation of the depletion width () for varying gate voltage () is best represented by
 Tap to open full size
Figure description
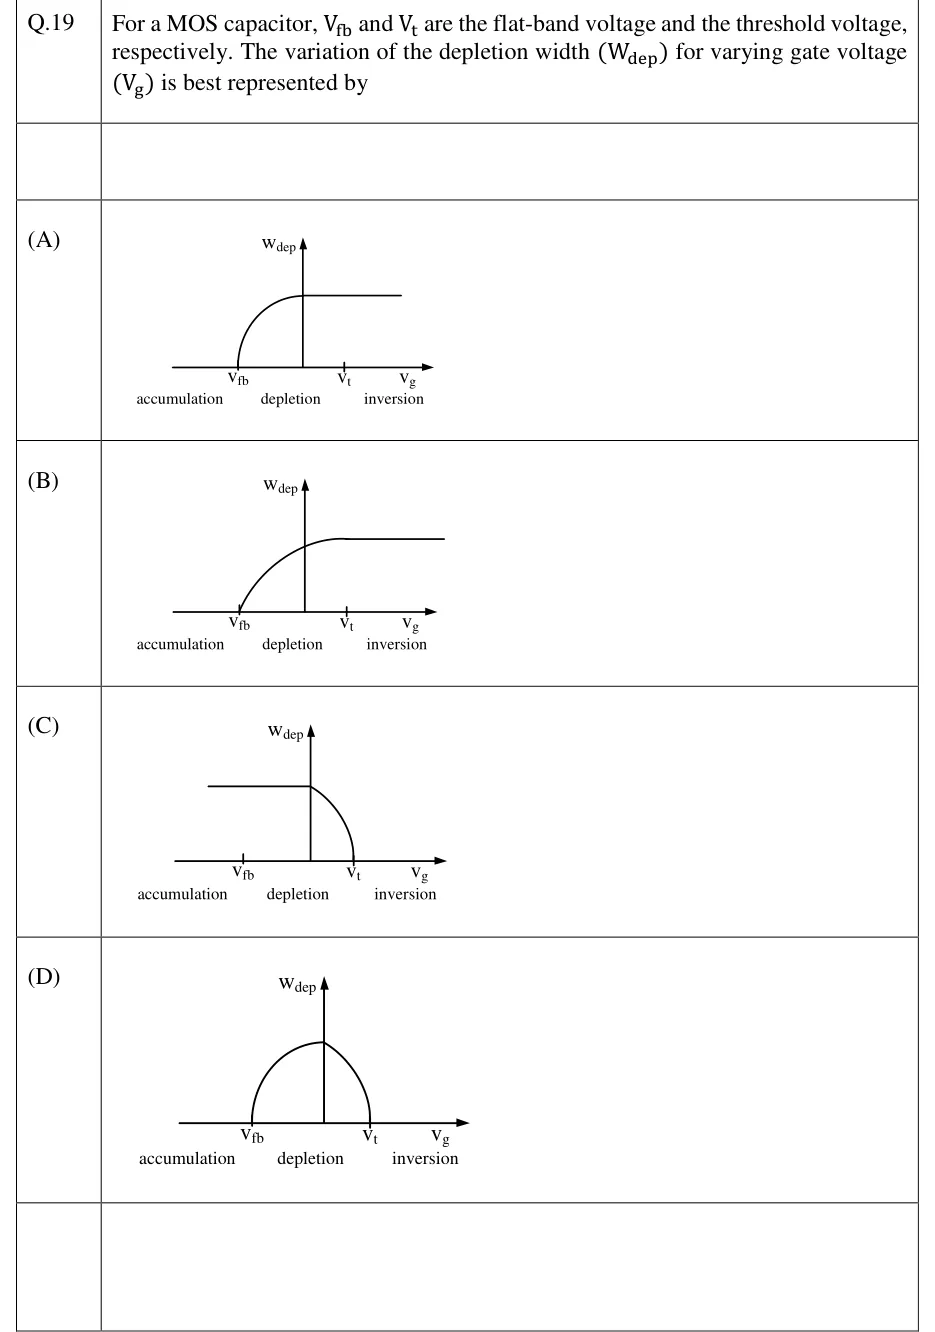
Four candidate plots of W_dep (y-axis) vs V_g (x-axis), each x-axis marked with two ticks V_fb (left) and V_t (right), and labelled below into three regions: accumulation (left of V_fb), depletion (between V_fb and V_t), inversion (right of V_t). (A) W_dep=0 left of a point left of V_fb, then a rising curve that saturates to a flat plateau before reaching V_t, plateau continues flat through and beyond V_t. (B) W_dep=0 up to V_fb, then rises smoothly from V_fb and saturates to a flat plateau right around V_t, staying flat for all V_g>V_t. (C) W_dep starts at a nonzero flat plateau for V_g<V_t (extending through accumulation and depletion) then curves down to zero at and beyond V_t. (D) W_dep=0 at V_fb and at V_t, rising to a single peak (arch/triangular shape) in between, zero again for V_g>V_t.
- (A)
Figure — Wdep rises before Vfb and saturates to a plateau before Vt is reached (early saturation, offset from the marked voltages)
- (B)
Figure — Wdep = 0 for Vg < Vfb, rises smoothly starting exactly at Vfb, and saturates to a constant plateau at Vg = Vt, remaining flat through inversion
- (C)
Figure — Wdep starts at a constant nonzero value through accumulation and depletion, then decreases to zero at Vt and stays zero in inversion
- (D)
Figure — Wdep = 0 in accumulation and inversion, rising to a single peak only inside the depletion region between Vfb and Vt (arch shape)