
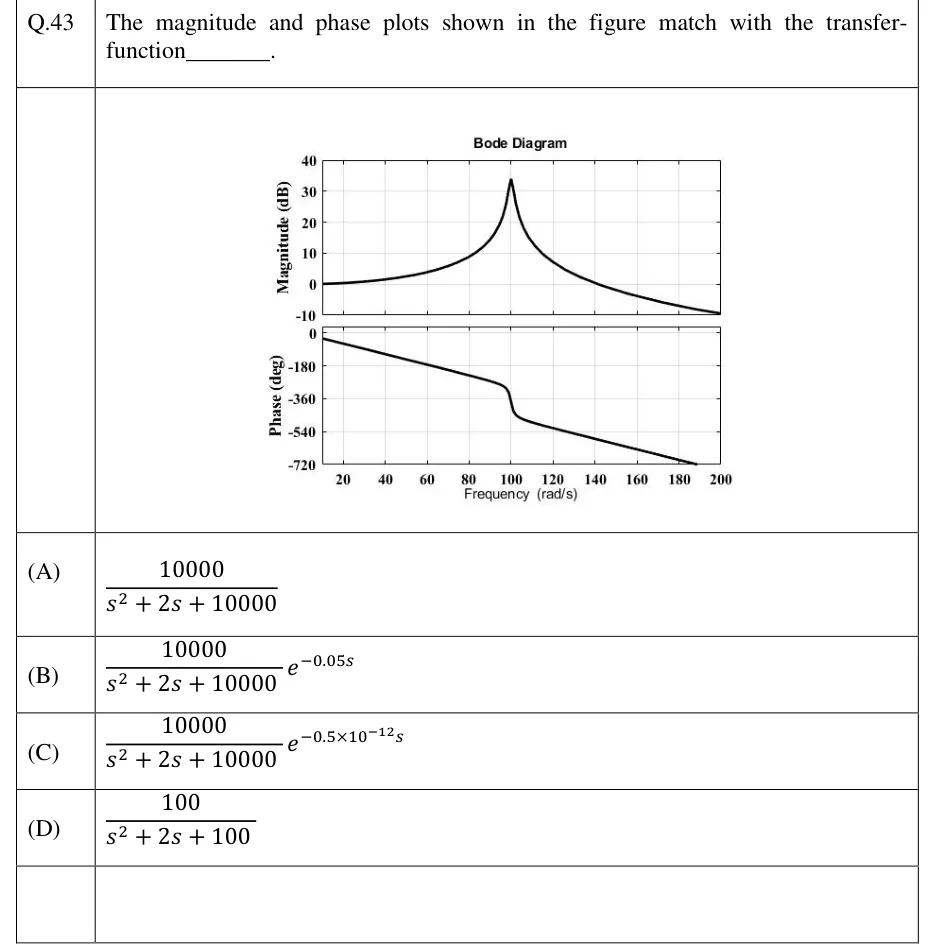
The magnitude and phase plots shown in the figure match with the transfer-function ________.
 Tap to open full size
Figure description
A plot titled 'Bode Diagram' with two stacked panels that share a LINEAR frequency axis labelled 'Frequency (rad/s)'. The axis runs from about 10 rad/s at the left edge to 200 rad/s, with ticks at 20, 40, 60, 80, 100, 120, 140, 160, 180 and 200. Top panel: 'Magnitude (dB)', axis from -10 to 40 (ticks -10, 0, 10, 20, 30, 40). The curve starts at 0 dB at the left edge, rises slowly and then steeply to a sharp resonant peak of about 33 to 34 dB at 100 rad/s, then falls, crossing 0 dB near 140 rad/s and ending just above -10 dB at 200 rad/s. Bottom panel: 'Phase (deg)', axis from -720 to 0 (ticks 0, -180, -360, -540, -720). The phase is about -30 deg at the left edge (about 10 rad/s). It falls along a straight line (linear in omega), crosses -180 deg a little past 60 rad/s and reaches about -300 deg just below 100 rad/s. Around 100 rad/s it drops steeply by roughly 150 to 180 deg to about -450 deg. It then keeps falling along a straight line of the same slope and leaves the bottom of the axes at -720 deg at about 189 rad/s.
- (A)
- (B)
- (C)
- (D)