
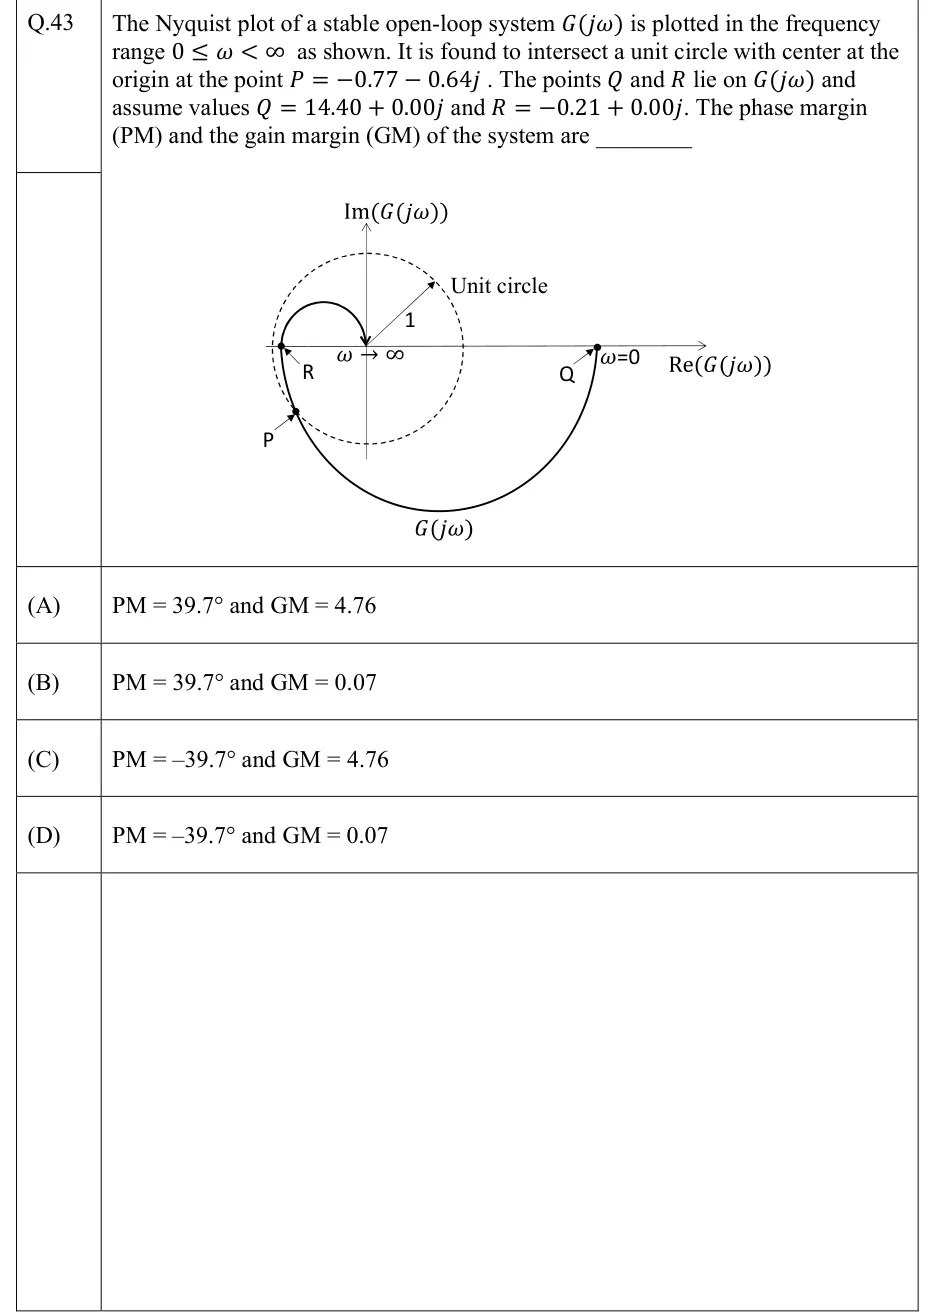
The Nyquist plot of a stable open-loop system is plotted in the frequency range as shown. It is found to intersect a unit circle with center at the origin at the point . The points and lie on and assume values and . The phase margin (PM) and the gain margin (GM) of the system are ________
 Tap to open full size
Figure description
Nyquist plot on axes Re(G(jω)) (horizontal, arrow to the right) and Im(G(jω)) (vertical, arrow upward). A dashed unit circle is centred at the origin. A radius arrow from the origin to the upper right is labelled 1, and the label 'Unit circle' has an arrow pointing to the circle. The solid curve, labelled G(jω) under its lower arc, starts at the point labelled Q on the positive real axis, well outside the circle, where it is marked ω=0. From Q it runs clockwise: down through the fourth quadrant in a large arc beneath the origin, then into the third quadrant, where it meets the dashed circle at the point labelled P (lower left). It then rises and crosses the negative real axis at the point labelled R, drawn just inside the left edge of the circle. After that it curls up into the second quadrant in a small loop above the axis and comes down into the origin from above, where it is marked ω → ∞. Only the letters P, Q and R are printed on the figure; their numerical values are given in the stem. The point −1 is not marked, and the figure is not to scale (R = −0.21 is drawn close to the circle's edge).
- (A)
and
- (B)
and
- (C)
and
- (D)
and