
IAE Academy

GATE 2023 EE Q.36: solution and answer

GATE 2023 · EEQ.36 · 2 marks · MCQ

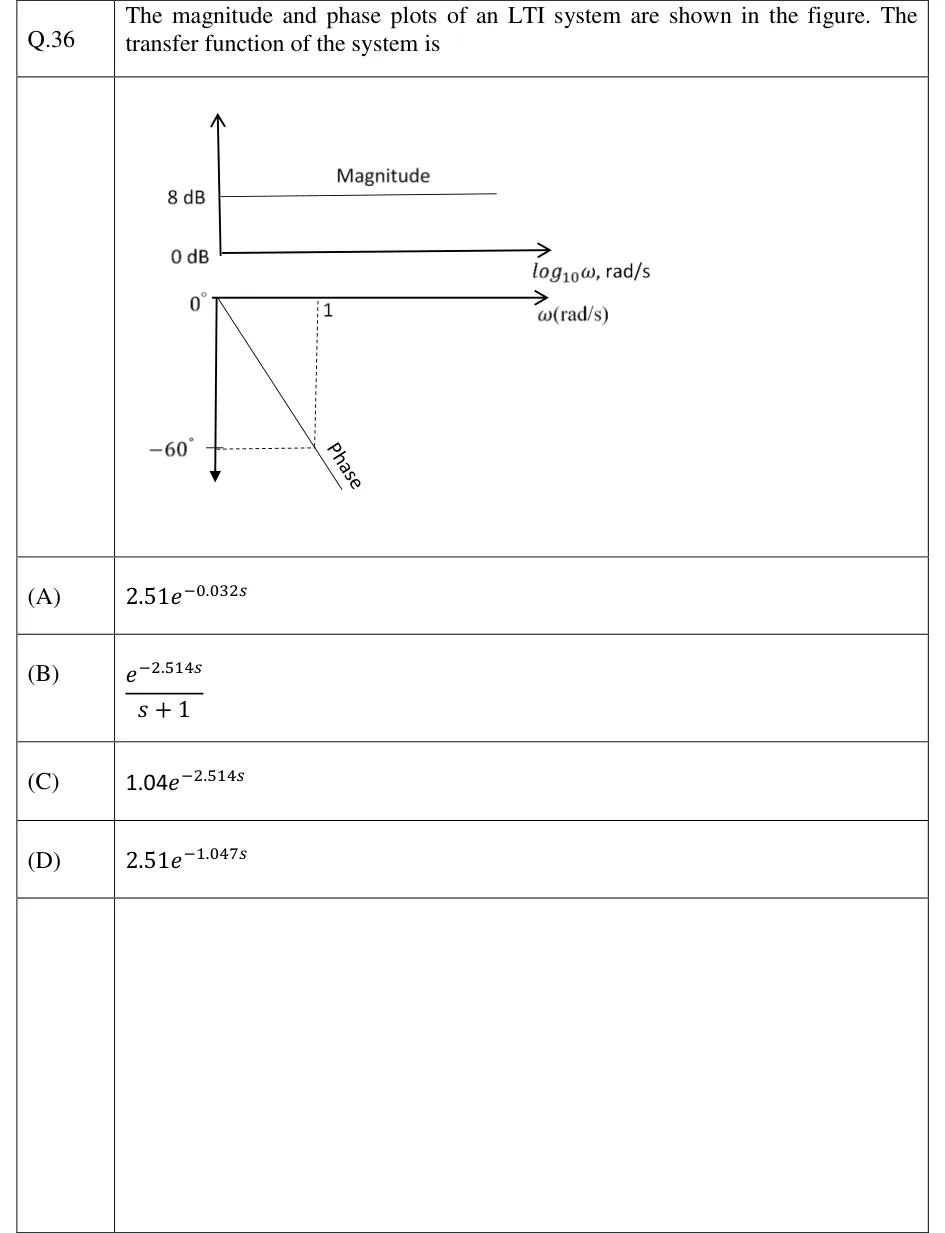
The magnitude and phase plots of an LTI system are shown in the figure. The transfer function of the system is
GATE 2023 EE question 36: Two plots stacked vertically.Tap to open full size
Figure from the GATE 2023 EE paper. It is part of the question.
Figure description

Two plots stacked vertically. Top (Magnitude): vertical axis marked 0 dB and 8 dB; horizontal axis labelled log_10 ω, rad/s. The magnitude is a flat horizontal line at 8 dB for all frequencies. Bottom (Phase): horizontal axis labelled ω (rad/s) on a linear scale, starting at 0 degrees at the origin; vertical axis pointing downward, marked 0 degrees and -60 degrees. The phase is a straight line starting at 0 degrees at ω = 0 and falling linearly; dashed lines show it passes through -60 degrees at ω = 1 rad/s. The line is labelled 'Phase'.

  1. (A)

  2. (B)

  3. (C)

  4. (D)

Answer and solution

ANSWER

The transfer function is , option (D): a gain of times a pure delay of .

Official answer: DSource: Official answer key, GATE 2023 EE (IIT Kanpur)

  1. Flat magnitude means no poles or zeros. stays at 8 dB at every frequency, so is a constant gain times a factor of unit magnitude. That rules out option (B): its factor gives 0 dB at (not 8 dB) and rolls the magnitude off above .

  2. Gain from decibels: That rules out option (C), whose gain of 1.04 would plot at only about 0.34 dB.

  3. A phase that falls linearly against itself means a pure time delay. Note the phase plot's axis is , not . For , putting gives and rad: constant magnitude and a straight-line phase through the origin, exactly as plotted.

  4. Delay from the marked point: at the phase is rad, so

  5. Transfer function: , which is option (D). As a check on the others: option (A)'s would give only about at , and option (C)'s would give about .

KEY IDEA

A pure time delay has unit magnitude at every frequency and phase . So a flat magnitude plot together with a phase that falls in a straight line against (linear axis) means gain times delay. Read the gain from the dB level () and the delay from the slope of the phase line, working in radians.

WATCH OUT FOR

Taking the delay as because the phase is at : is in radians, so . A second slip is reading the dB value as the gain itself, or converting with (a power ratio) instead of . matches no option, but the axis on the magnitude plot can also push students to treat the phase plot as logarithmic, where a delay does not plot as a straight line.

From the GATE 2023 EE paper. Every question of this paper · Download the full paper · All 27 Bode & margins questions, with notes

More Bode & margins questions