
For a real signal, which of the following is/are valid power spectral density/densities?
 Tap to open full size
Figure description
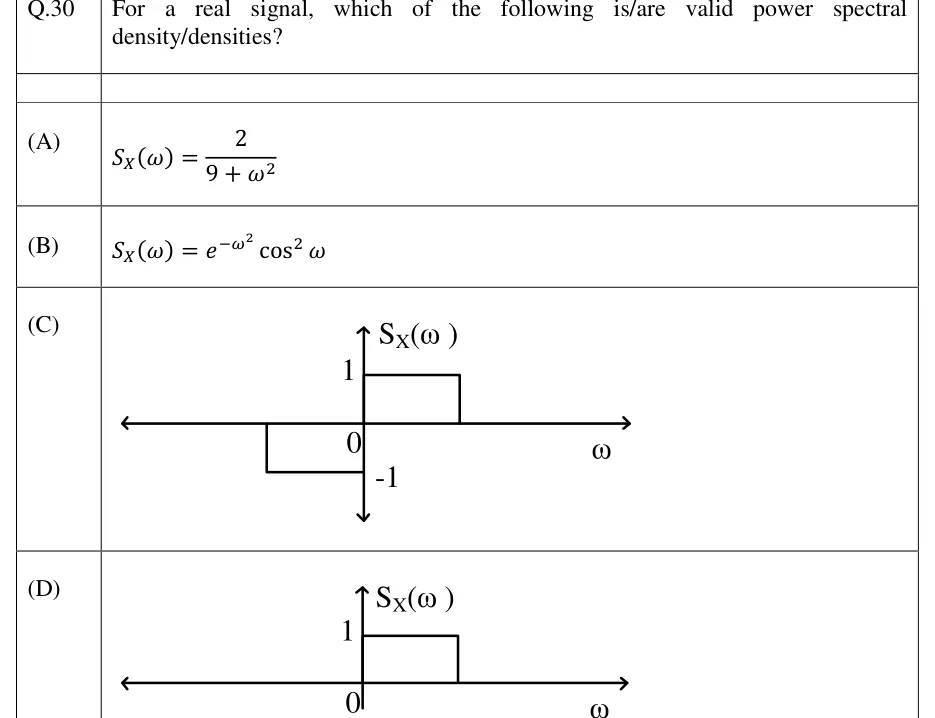
Options (C) and (D) are plots of S_X(omega) against omega. (C): horizontal omega axis with arrows at both ends and vertical S_X(omega) axis. For omega > 0 there is a rectangular pulse of height 1 from omega = 0 to a positive omega value. For omega < 0 there is a rectangular pulse of height -1 (below the axis) from a negative omega value up to omega = 0. The levels 1 and -1 are labelled on the vertical axis. (D): same axes, with a rectangular pulse of height 1 from omega = 0 to a positive omega value only, and nothing for omega < 0 (the crop ends at the omega axis, with the lower half cut off).
- (A)
S_X(omega) = 2/(9 + omega^2)
- (B)
S_X(omega) = e^{-omega^2} cos^2(omega)
- (C)
Figure — S_X(omega) equal to +1 on a band 0 < omega < omega_1 and equal to -1 on a band -omega_1' < omega < 0 (odd-shaped, taking negative values)
- (D)
Figure — S_X(omega) equal to 1 on a band 0 < omega < omega_1 only, zero for omega < 0 (one-sided, not symmetric about omega = 0)