
Consider an additive white Gaussian noise (AWGN) channel with bandwidth and noise power spectral density . Let denote the average transmit power constraint.
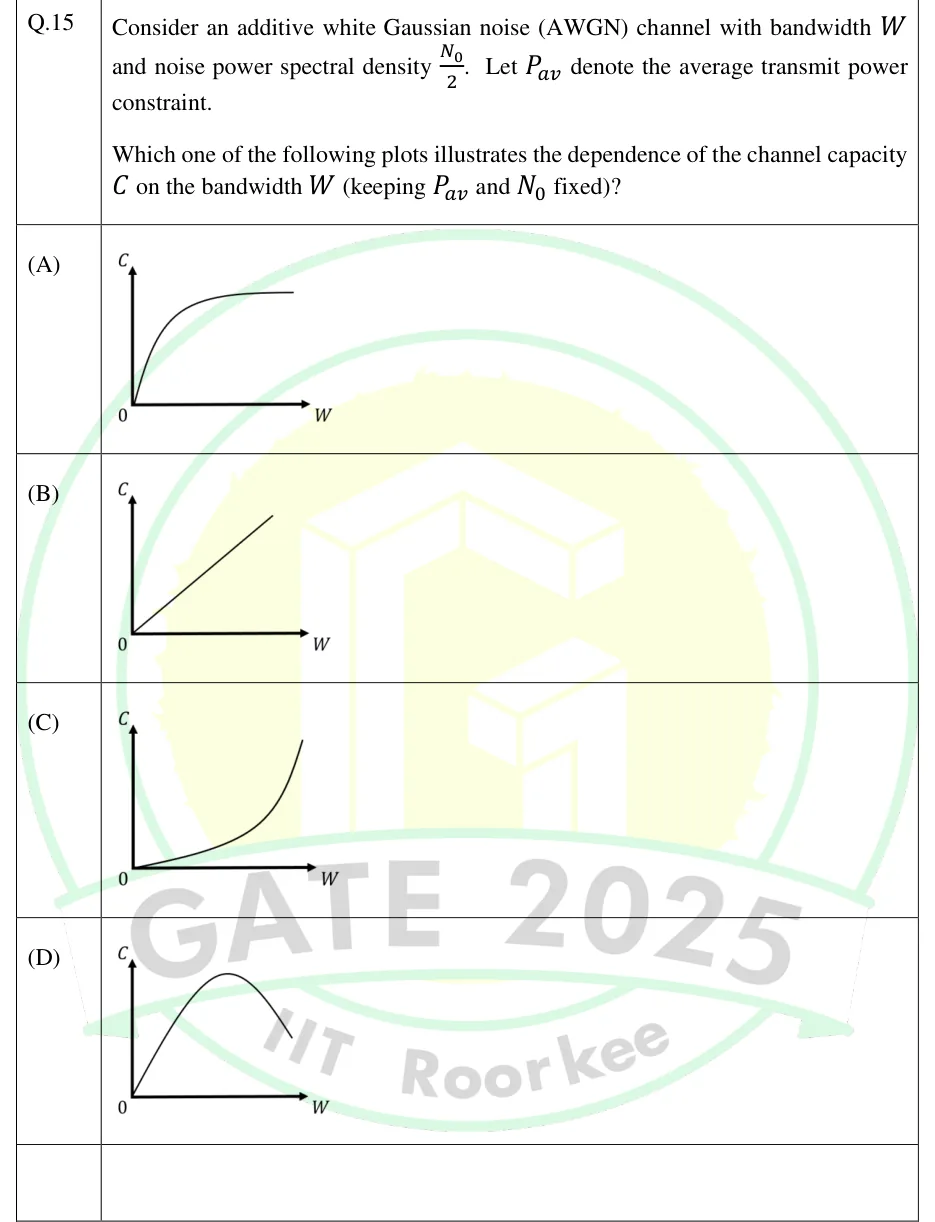
Which one of the following plots illustrates the dependence of the channel capacity on the bandwidth (keeping and fixed)?
 Tap to open full size
Figure description
Four small plots, each with the vertical axis labelled C and the horizontal axis labelled W, both starting at the origin 0. (A) A concave curve that rises steeply from the origin and flattens out to a horizontal asymptote (saturating). (B) A straight line through the origin with constant positive slope. (C) A convex curve that starts with a small slope near the origin and rises ever more steeply (exponential-like growth). (D) A curve that rises from the origin, reaches a single peak, and then falls as W increases.
- (A)
Figure — C versus W: concave curve rising steeply from the origin and saturating at a horizontal asymptote.
- (B)
Figure — C versus W: straight line through the origin with constant positive slope.
- (C)
Figure — C versus W: convex curve starting with a small slope and rising increasingly steeply.
- (D)
Figure — C versus W: curve rising from the origin to a peak and then decreasing.