
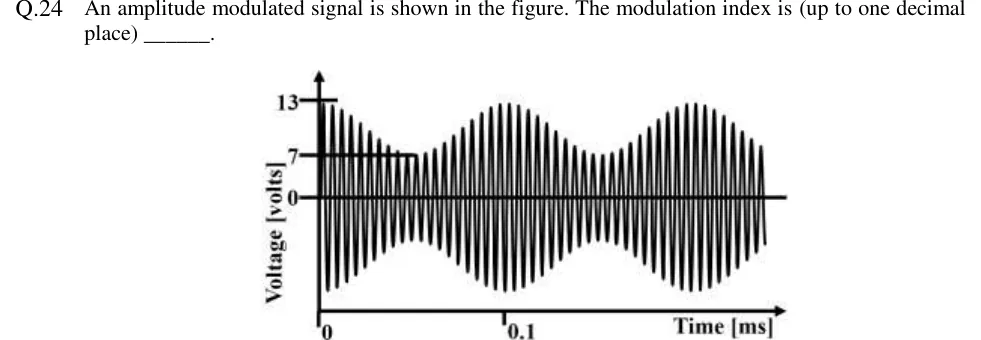
An amplitude modulated signal is shown in the figure. The modulation index is (up to one decimal place) ______.
 Tap to open full size
Figure description
Voltage [volts] versus Time [ms] plot of an AM waveform. The vertical axis has labelled levels 13, 7 and 0, with the zero line drawn across the plot. The time axis is marked at 0 and 0.1. The carrier oscillates rapidly, and its envelope varies sinusoidally in time. The envelope peaks (maximum amplitude) at the level 13 V, marked with a horizontal line from the 13 label. The envelope troughs (minimum amplitude) at the level 7 V, marked with a horizontal line from the 7 label out to the first trough. The envelope completes about two cycles over the plotted interval, with a peak near the start, a trough, a second peak near 0.1 ms, and so on. The waveform is symmetric about the zero line.