
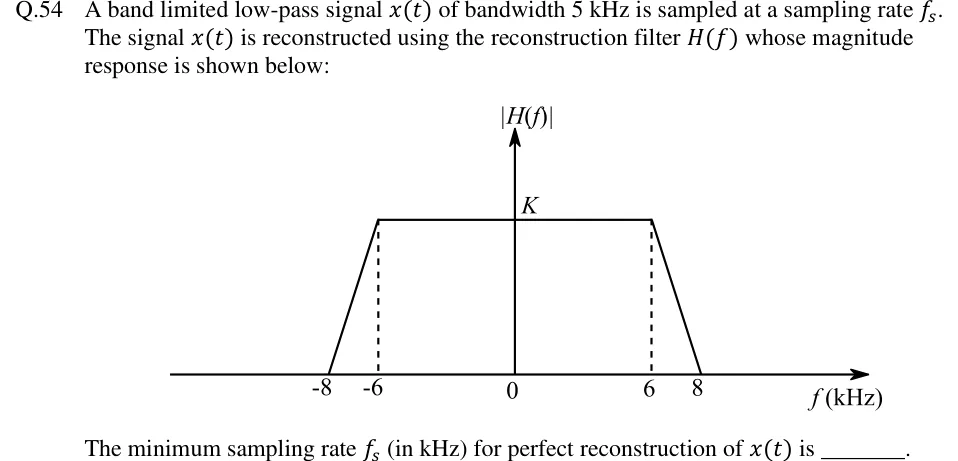
A band limited low-pass signal of bandwidth 5 kHz is sampled at a sampling rate . The signal is reconstructed using the reconstruction filter whose magnitude response is shown below:
[Figure]
The minimum sampling rate (in kHz) for perfect reconstruction of is ______.
 Tap to open full size
Figure description
Plot of |H(f)| (vertical axis) against f (kHz) (horizontal axis). The magnitude response is a symmetric trapezoid centred at f = 0: it is flat at height K for -6 ≤ f ≤ 6 kHz (dashed vertical lines drop from the corners at f = -6 and f = 6), falls linearly from K to 0 between f = 6 and f = 8 kHz on the right and between f = -6 and f = -8 kHz on the left, and is zero for |f| ≥ 8 kHz. Axis labels marked: -8, -6, 0, 6, 8 on the frequency axis; K on the vertical axis.