
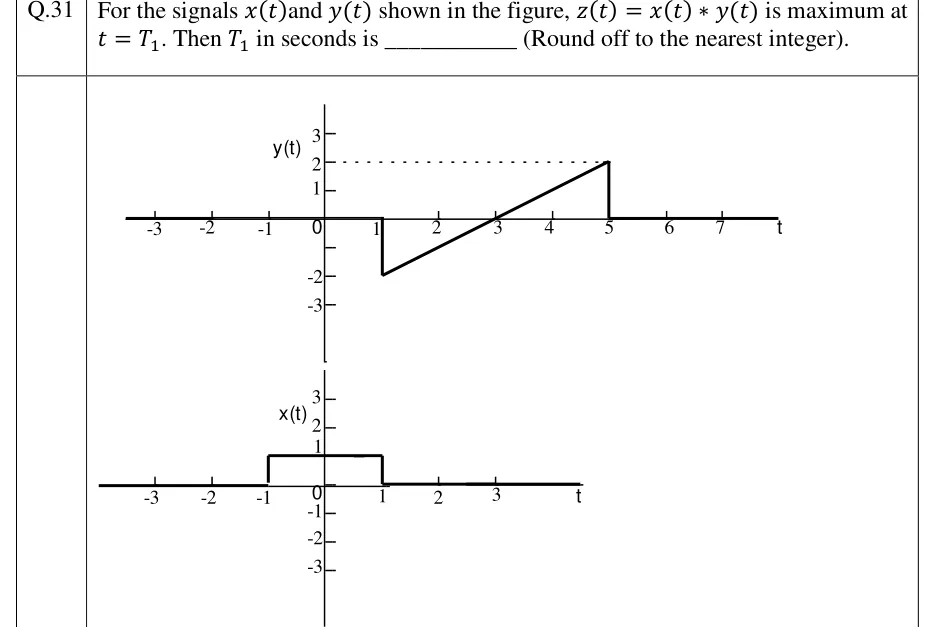
For the signals and shown in the figure, is maximum at . Then in seconds is ________ (Round off to the nearest integer).
 Tap to open full size
Figure description
Two plots against t. Upper plot, y(t): zero for t < 1; at t = 1 it jumps down to -2, then rises linearly (slope 1) through 0 at t = 3 to +2 at t = 5 (a dotted line marks the level 2 back to the vertical axis); at t = 5 it drops vertically to 0 and stays zero for t > 5. Vertical axis ticks -3 to 3, horizontal ticks -3 to 7. Lower plot, x(t): a rectangular pulse of height 1 from t = -1 to t = 1, zero elsewhere. Vertical axis ticks -3 to 3, horizontal ticks -3 to 3.