
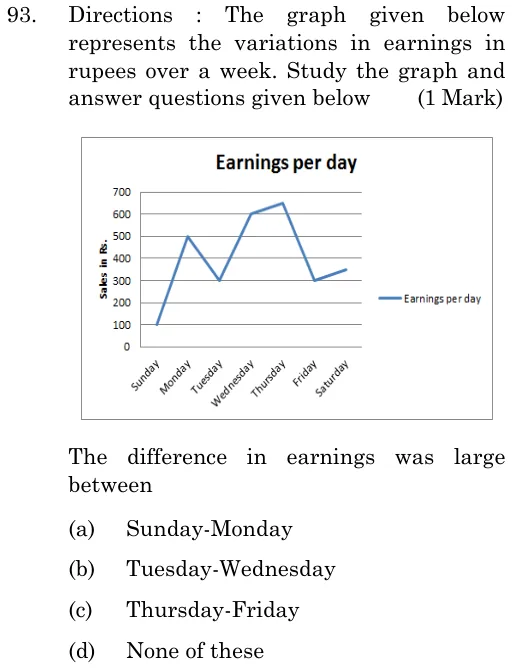
Directions: The graph given below represents the variations in earnings in rupees over a week. Study the graph and answer questions given below. The difference in earnings was large between
 Tap to open full size
Figure description
Line chart titled 'Earnings per day'. Vertical axis labelled 'Sales in Rs.' from 0 to 700 in steps of 100. Horizontal axis lists Sunday, Monday, Tuesday, Wednesday, Thursday, Friday, Saturday. A single blue line (legend: Earnings per day) joins the points Sunday 100, Monday 500, Tuesday 300, Wednesday 600, Thursday 650, Friday 300, Saturday 350.
- (A)
Sunday-Monday
- (B)
Tuesday-Wednesday
- (C)
Thursday-Friday
- (D)
None of these