
IAE Academy

ISRO EC 2025 Q.56: solution and answer

ISRO 2025 · ECQ.56 · 1 mark · MCQ

Consider the following Bode plot, the transfer function of this system shall be
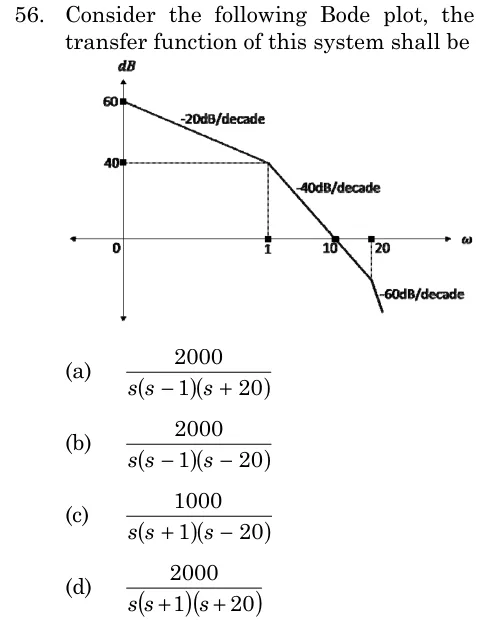
ISRO EC 2025 question 56: Magnitude Bode plot, dB on the vertical axis and omega on the horizontal axis.Tap to open full size
Figure from the ISRO EC 2025 paper. It is part of the question.
Figure description

Magnitude Bode plot, dB on the vertical axis and omega on the horizontal axis. The 0 dB level is the horizontal axis, with 40 dB and 60 dB marked above it on the dB axis. The curve starts at 60 dB on the dB axis, with slope -20 dB/decade, and falls to 40 dB at omega = 1 (a dashed horizontal line from 40 dB and a dashed vertical line down to omega = 1 mark this corner). From omega = 1 the slope is -40 dB/decade; the curve crosses 0 dB at omega = 10. At omega = 20 (marked by a dashed vertical line) the slope changes to -60 dB/decade and continues downward.

  1. (A)

    2000 / [ s (s − 1)(s + 20) ]

  2. (B)

    2000 / [ s (s − 1)(s − 20) ]

  3. (C)

    1000 / [ s (s + 1)(s − 20) ]

  4. (D)

    2000 / [ s (s + 1)(s + 20) ]

Answer and solution

ANSWER

The transfer function is , which is option (D).

Official answer: DSource: ISRO's final answer key of 15 May 2026

  1. The initial slope is , so there is one pole at the origin: .

  2. At the slope steepens from to , so there is a simple pole at . At it steepens from to , so there is a simple pole at . The slope never rises, so there are no zeros.

  3. In Bode form: .

  4. For only the term matters. The plot reads at , so and . At this gives , matching the level on the plot.

  5. Hence

  6. Check: between and the slope is , so the level falls by , from to at . This matches the plot.

  7. A magnitude plot cannot show the sign of a pole, so the stable minimum-phase form is taken, with poles at and . Options (a), (b) and (c) contain or , which are right-half-plane poles. Option (c) also has the wrong gain: its low-frequency constant is , not . Only option (d) matches.

KEY IDEA

Read the corner frequencies and slope changes off the asymptotic Bode plot: each step is a simple pole, and the gain comes from the low-frequency segment, here at .

WATCH OUT FOR

Forgetting to convert the Bode form into the monic-factor form: the from the second pole multiplies the gain, giving rather than . Also, a magnitude plot does not show pole signs, so the stable form is chosen.

From the ISRO EC 2025 paper. Every question of this paper · The full paper (PDF, ISRO) · All 2 ISRO Bode & margins questions, with notes