
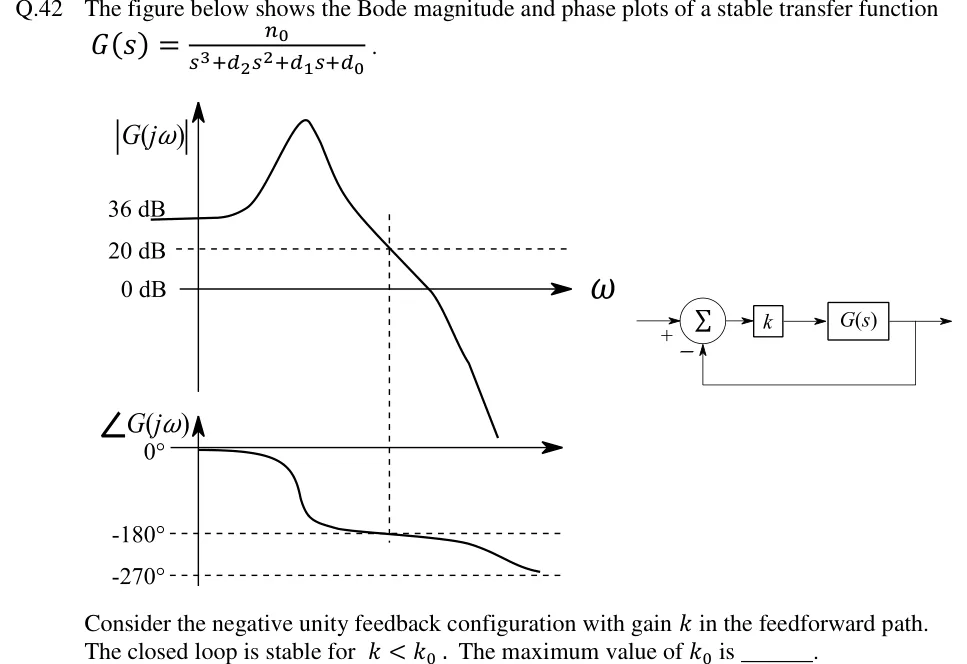
The figure below shows the Bode magnitude and phase plots of a stable transfer function .
Consider the negative unity feedback configuration with gain in the feedforward path. The closed loop is stable for . The maximum value of is ______.
 Tap to open full size
Figure description
Left: Bode plots sharing a common frequency axis. Magnitude plot: vertical axis |G(j ω)| with marked levels 36 dB, 20 dB (dashed horizontal line) and 0 dB (the ω axis). The curve starts flat at 36 dB at low frequency, rises to a sharp resonant peak, then falls, crossing the 20 dB dashed line at a frequency marked by a vertical dashed line, then crosses 0 dB, then drops steeply. Phase plot: vertical axis ∠ G(j ω) with marked levels 0°, -180° (dashed) and -270° (dashed). The phase starts at 0°, drops sharply near the resonant frequency to just above -180°, then decreases slowly and crosses -180° exactly at the same vertical dashed frequency where the magnitude is 20 dB, then continues down towards -270° at high frequency. Right: block diagram — reference enters a summing junction with sign +, the junction output goes to a gain block k, then to block G(s), whose output is the system output; the output is fed back with unity gain to the summing junction with sign −.